| Start Page |
|
 |
| Start Page |
|
|
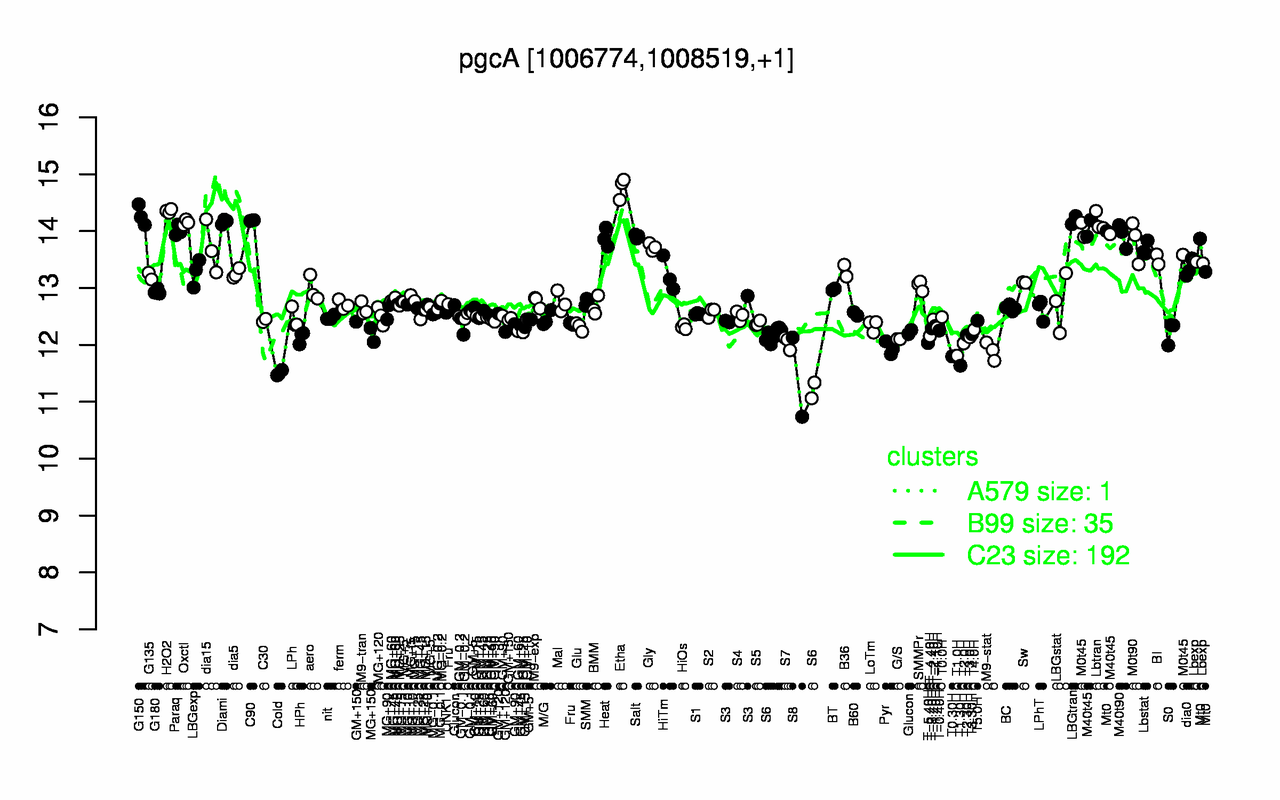
| Etha | H2O2 | G150 | LBGtran | C90 | Diami | Lbtran | Oxctl | M40t45 | Paraq |
| 14.8 | 14.4 | 14.3 | 14.2 | 14.2 | 14.2 | 14.2 | 14.2 | 14 | 14 |
| S8 | Cold | T1.30H | T0.30H | T1.0H | M9-stat | Pyr | S6 | T2.0H | T-5.40H |
| 11.4 | 11.5 | 11.6 | 11.8 | 11.8 | 11.9 | 11.9 | 12 | 12 | 12 |