| Start Page |
|
 |
| Start Page |
|
|
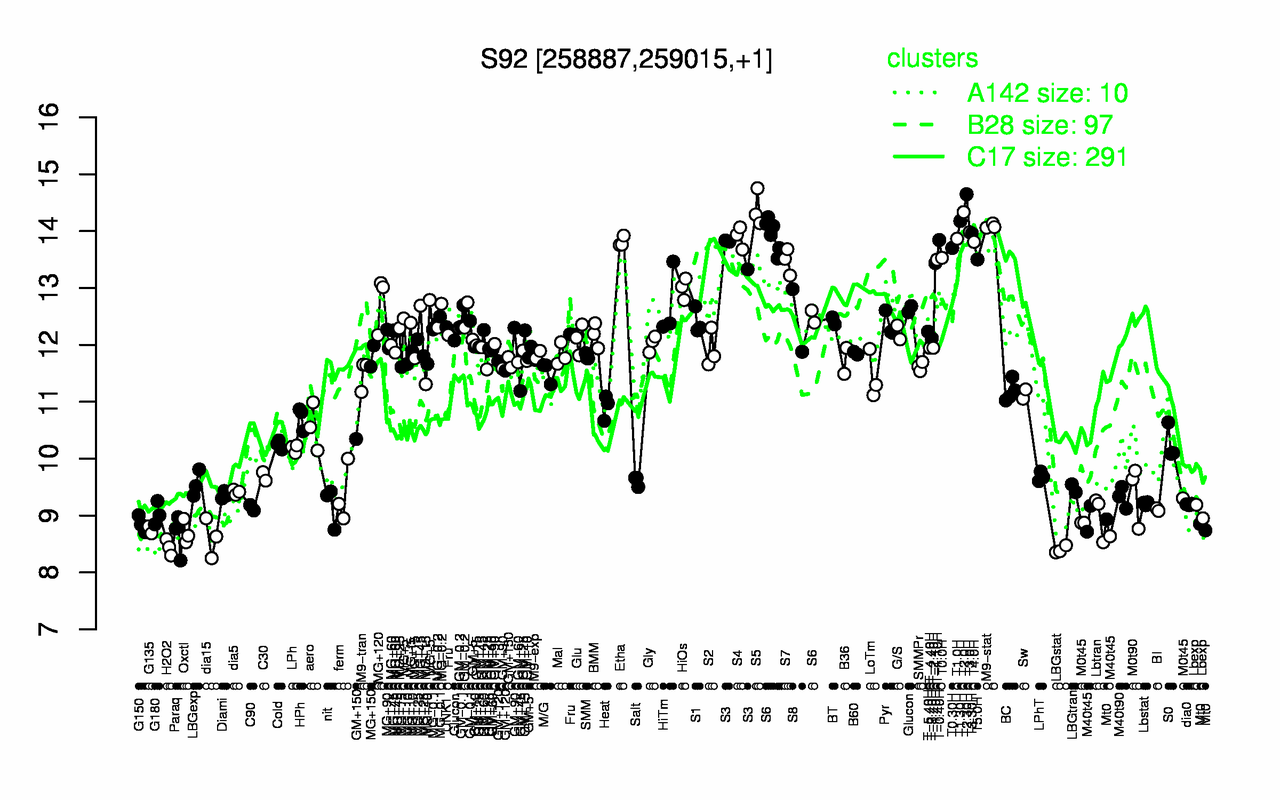
| T2.30H | S5 | T2.0H | T1.30H | M9-stat | T3.0H | T3.30H | S4 | T1.0H | T-0.40H |
| 14.6 | 14.4 | 14.3 | 14.2 | 14.1 | 14 | 14 | 13.9 | 13.9 | 13.8 |
| LBGstat | H2O2 | dia15 | Paraq | Oxctl | G135 | M40t45 | Mt0 | G150 | Lbtran |
| 8.4 | 8.44 | 8.61 | 8.65 | 8.71 | 8.75 | 8.84 | 8.84 | 8.85 | 9 |