| Start Page |
|
 |
| Start Page |
|
|
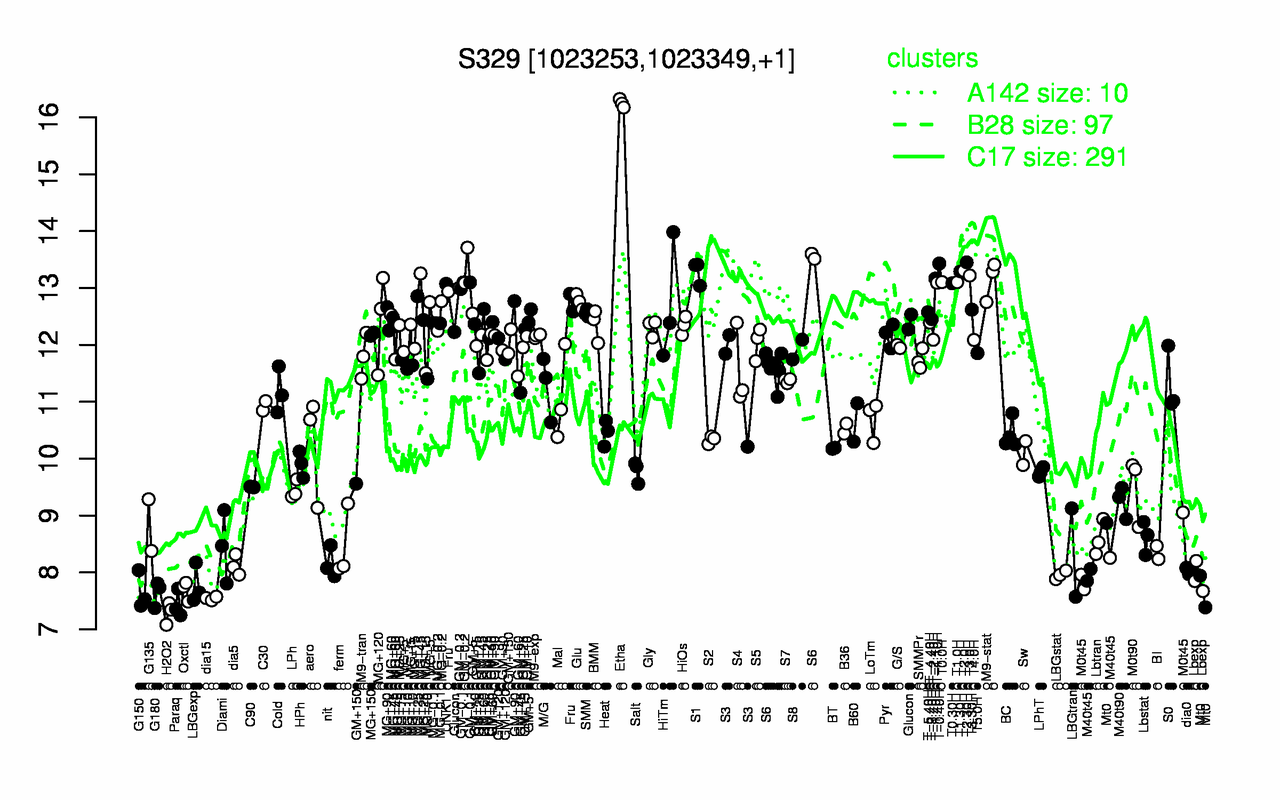
| Etha | T2.30H | T-0.40H | T2.0H | T1.30H | S1 | GM-0.2 | T3.0H | T-1.40H | M9-stat |
| 16.2 | 13.4 | 13.4 | 13.3 | 13.3 | 13.3 | 13.3 | 13.2 | 13.2 | 13.2 |
| H2O2 | Paraq | dia15 | G180 | G150 | Oxctl | LBGexp | Lbexp | LBGstat | dia0 |
| 7.29 | 7.44 | 7.54 | 7.64 | 7.66 | 7.69 | 7.78 | 7.91 | 7.96 | 8.02 |