| Start Page |
|
 |
| Start Page |
|
|
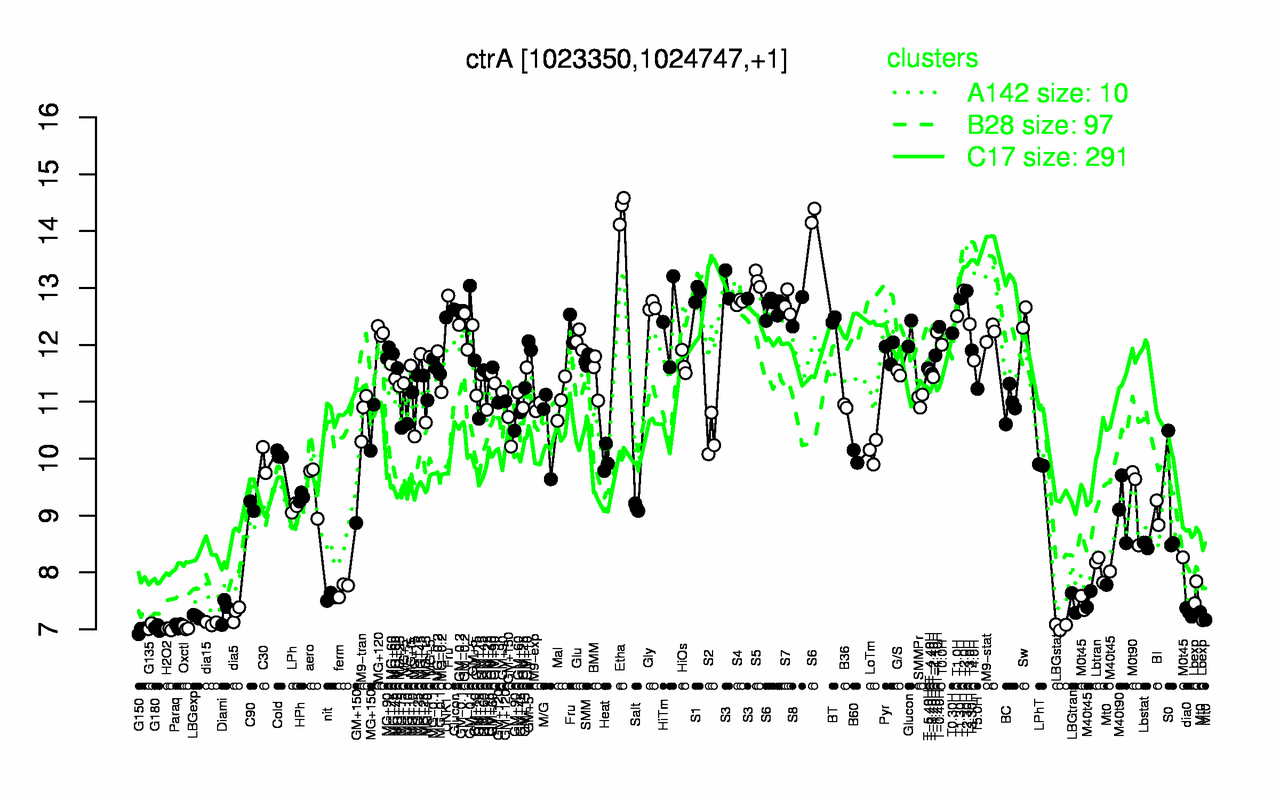
| Etha | S5 | S6 | S3 | T2.0H | T2.30H | S1 | T1.30H | S4 | GM-0.1 |
| 14.4 | 13.1 | 13 | 13 | 13 | 12.9 | 12.9 | 12.8 | 12.8 | 12.7 |
| G150 | H2O2 | G180 | Oxctl | LBGstat | G135 | Paraq | dia15 | LBGexp | dia5 |
| 6.98 | 7.01 | 7.02 | 7.03 | 7.05 | 7.05 | 7.06 | 7.11 | 7.23 | 7.28 |