| Start Page |
|
 |
| Start Page |
|
|
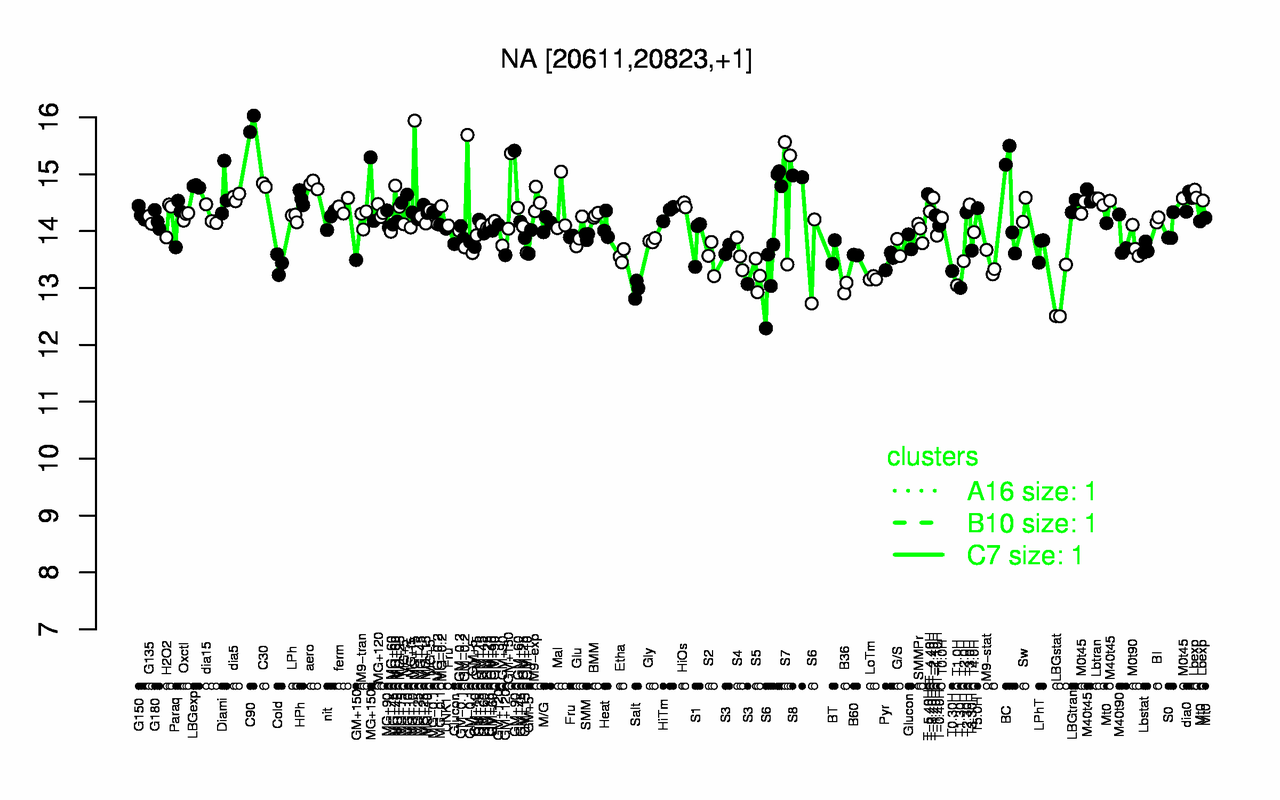
| C90 | S8 | MG+15 | aero | C30 | LBGexp | S7 | MG+150 | Diami | T-5.40H |
| 15.9 | 15 | 14.9 | 14.8 | 14.8 | 14.8 | 14.8 | 14.7 | 14.7 | 14.6 |
| LBGstat | Salt | B36 | T1.30H | T1.0H | LoTm | S5 | T0.30H | M9-stat | Cold |
| 12.8 | 13 | 13 | 13 | 13 | 13.2 | 13.2 | 13.3 | 13.4 | 13.4 |