| Start Page |
|
 |
| Start Page |
|
|
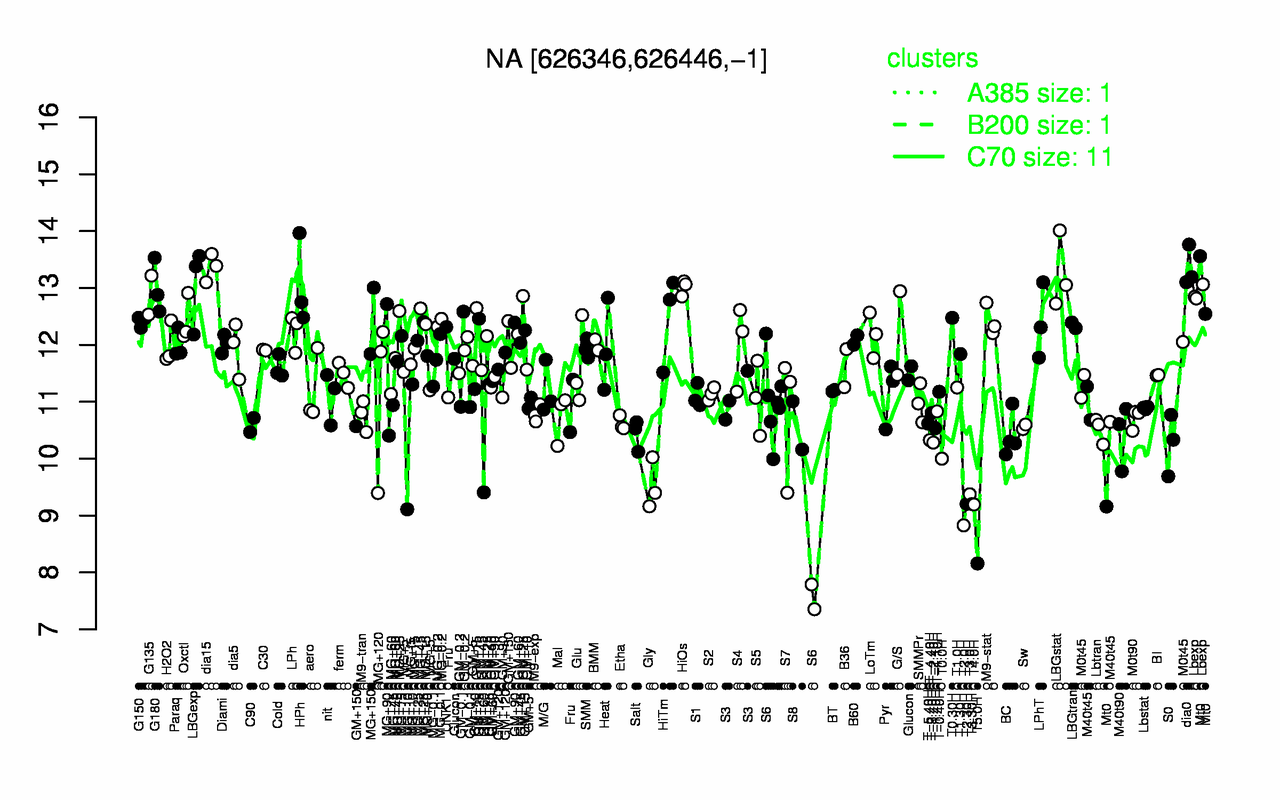
| dia15 | dia0 | LBGstat | HPh | LBGexp | HiOs | G180 | Lbexp | G135 | GM+25 |
| 13.4 | 13.4 | 13.3 | 13.1 | 13 | 13 | 13 | 12.9 | 12.9 | 12.5 |
| T5.0H | T2.0H | T4.0H | T3.30H | T2.30H | T3.0H | Gly | T0.0H | S6 | S0 |
| 8.16 | 8.83 | 9.19 | 9.2 | 9.21 | 9.37 | 9.53 | 10 | 10.2 | 10.3 |