| Start Page |
|
 |
| Start Page |
|
|
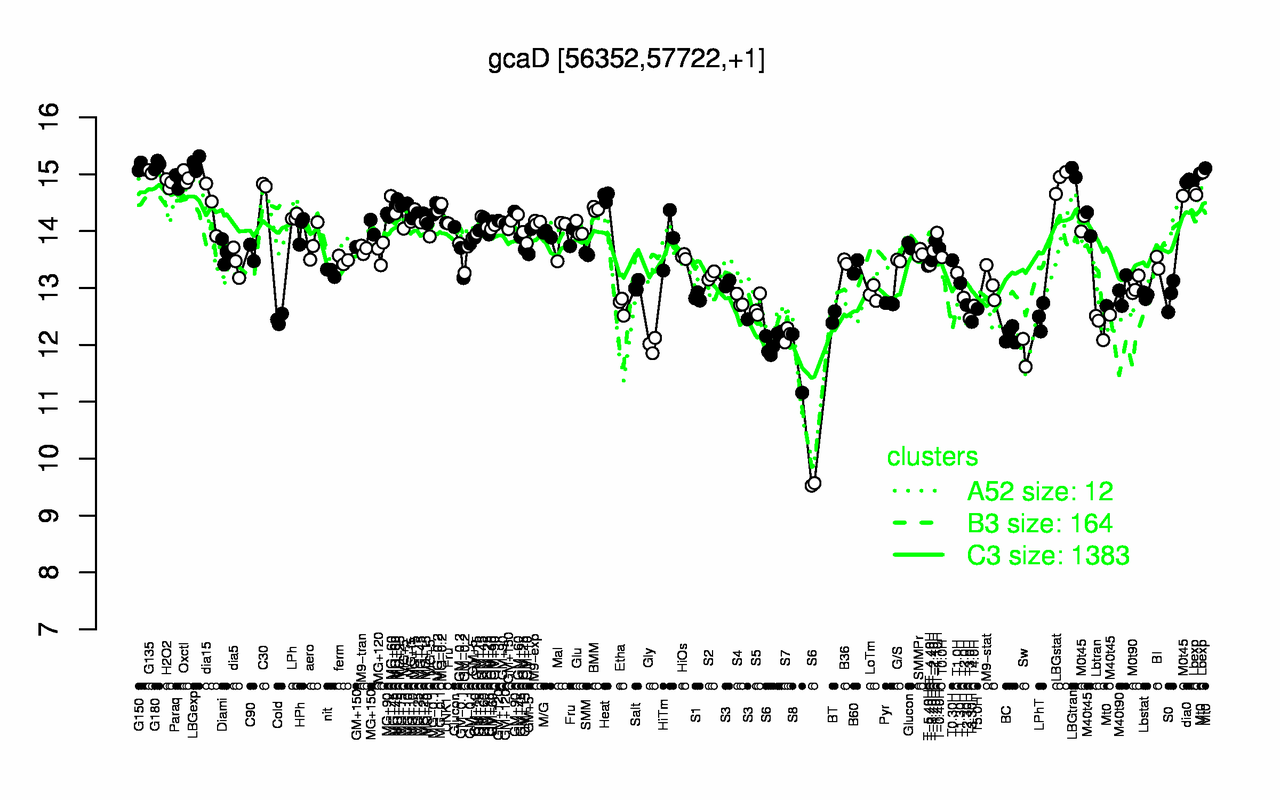
| LBGexp | G180 | G150 | G135 | LBGtran | Oxctl | LBGstat | dia0 | Paraq | H2O2 |
| 15.2 | 15.2 | 15.1 | 15 | 15 | 15 | 14.9 | 14.9 | 14.9 | 14.8 |
| S6 | S8 | Sw | Gly | BC | S7 | Lbtran | T3.30H | Cold | T3.0H |
| 11.5 | 11.7 | 11.9 | 12 | 12.2 | 12.2 | 12.3 | 12.4 | 12.5 | 12.5 |