| Start Page |
|
 |
| Start Page |
|
|
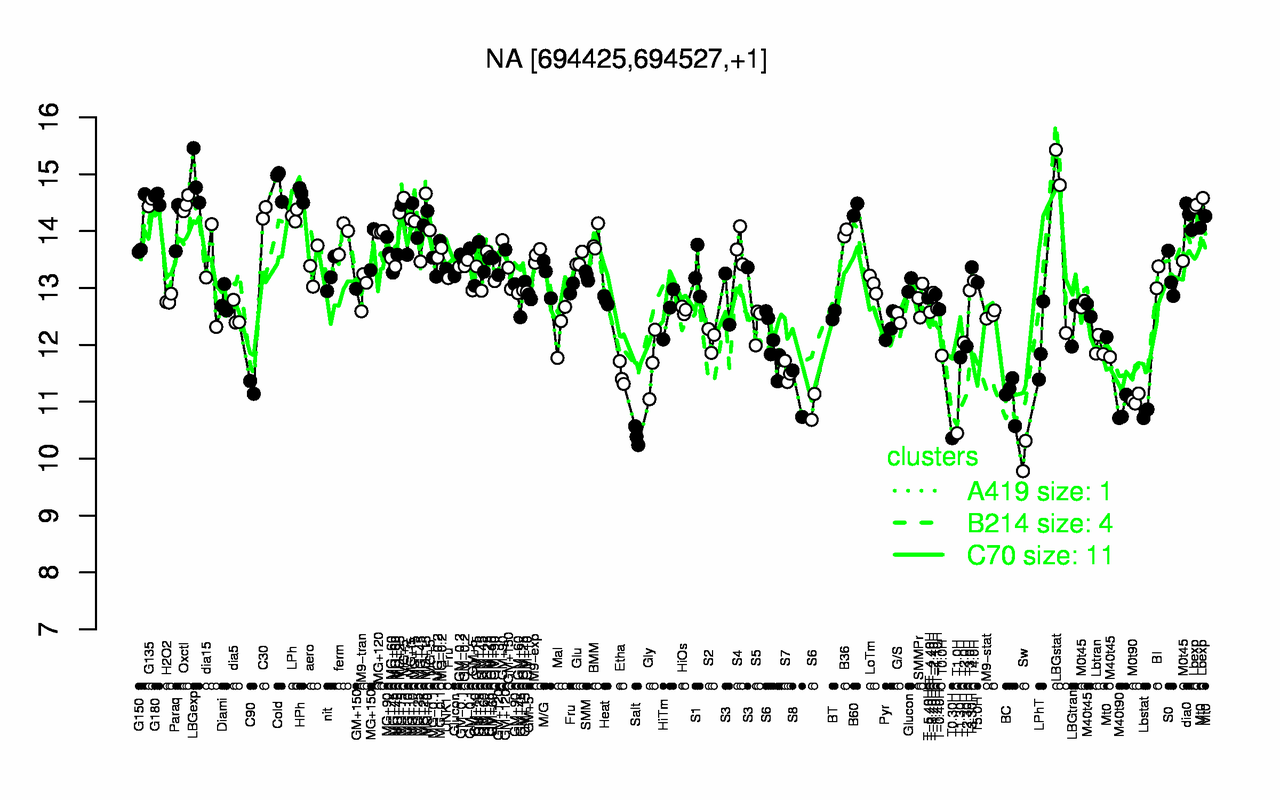
| LBGexp | Cold | HPh | G180 | G135 | Lbexp | Oxctl | MG+15 | B60 | C30 |
| 14.9 | 14.8 | 14.6 | 14.6 | 14.5 | 14.5 | 14.5 | 14.4 | 14.4 | 14.3 |
| Sw | T0.30H | Salt | T1.0H | Lbstat | M40t90 | M0t90 | BC | S8 | C90 |
| 10 | 10.4 | 10.4 | 10.4 | 10.8 | 10.9 | 11 | 11.1 | 11.1 | 11.3 |