| Start Page |
|
 |
| Start Page |
|
|
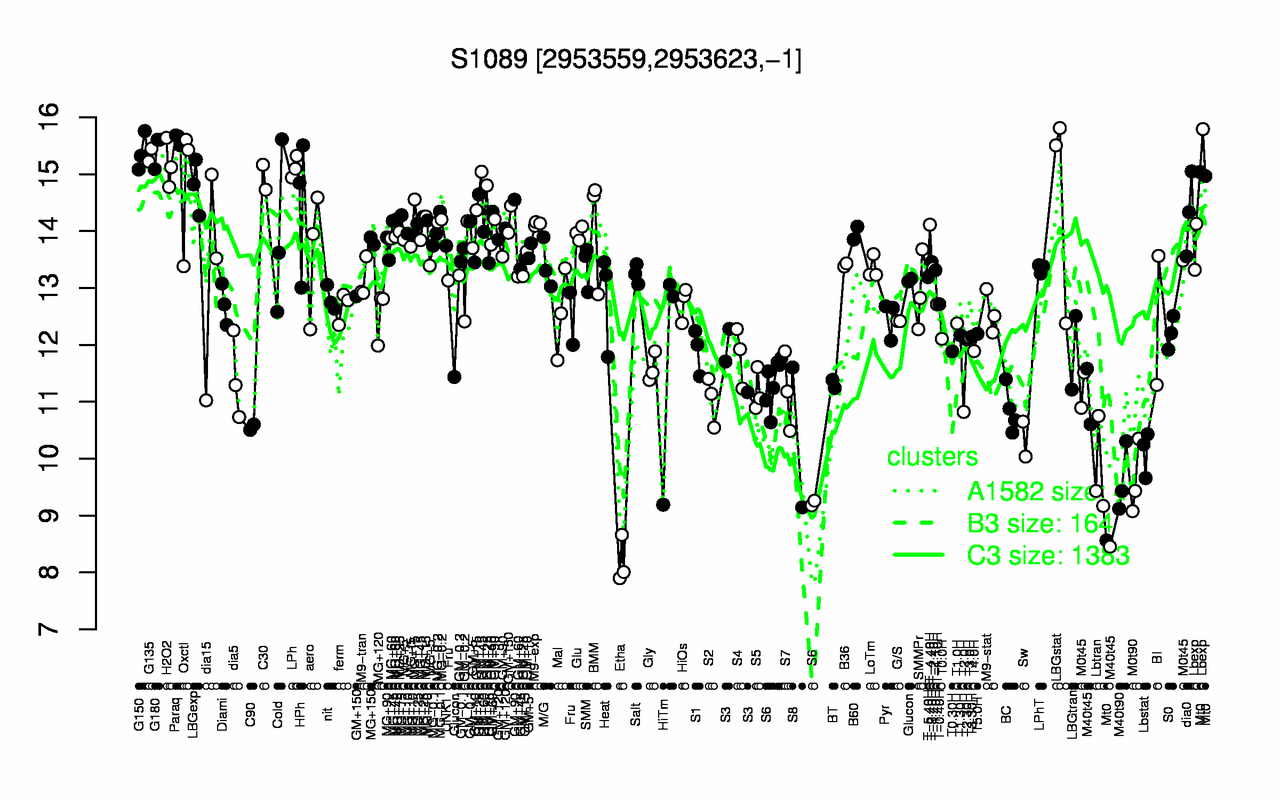
| Paraq | G180 | G150 | G135 | H2O2 | LPh | C30 | Oxctl | LBGexp | LBGstat |
| 15.6 | 15.4 | 15.4 | 15.3 | 15.2 | 15.1 | 14.9 | 14.8 | 14.8 | 14.6 |
| Etha | M40t90 | M0t90 | Lbtran | Lbstat | M40t45 | Sw | S8 | C90 | T2.0H |
| 8.19 | 9.62 | 9.62 | 9.78 | 10.1 | 10.2 | 10.3 | 10.4 | 10.6 | 10.8 |