| Start Page |
|
 |
| Start Page |
|
|
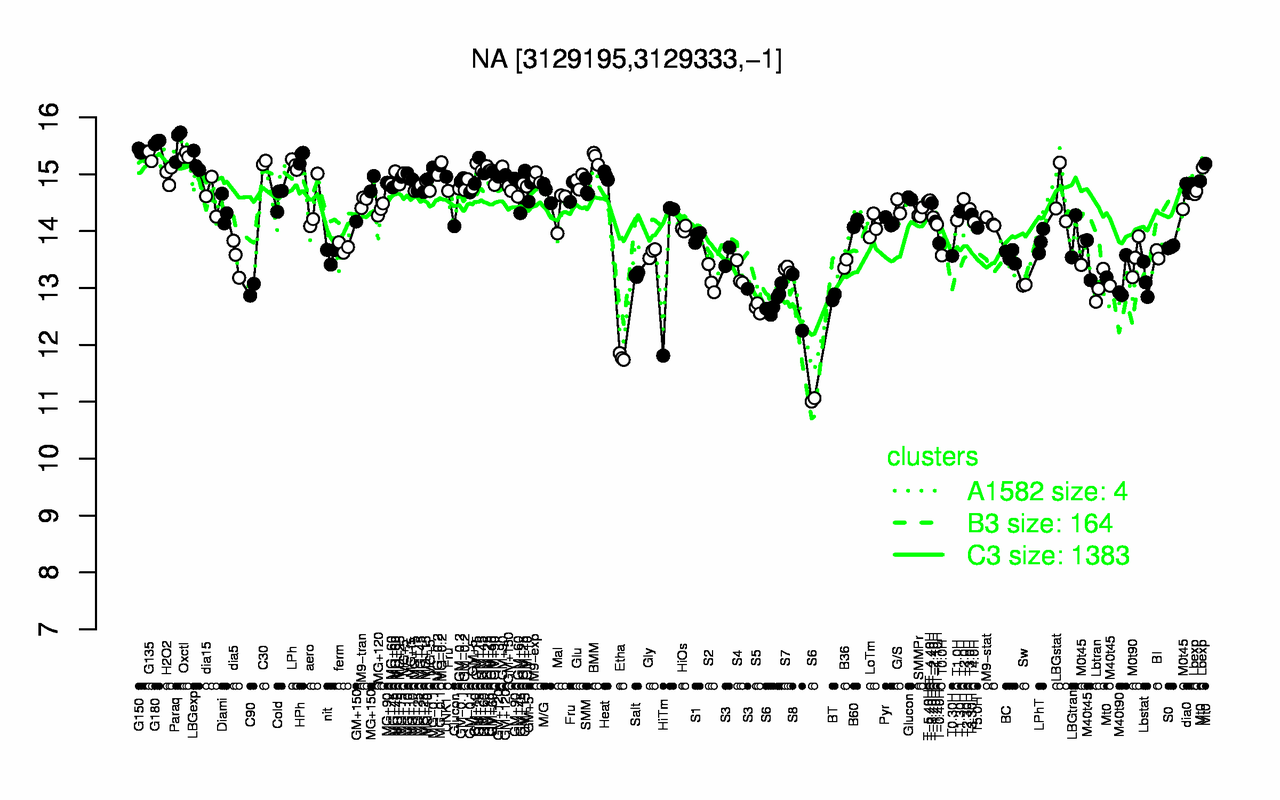
| G180 | Paraq | G150 | Oxctl | G135 | HPh | BMM | LBGexp | C30 | LPh |
| 15.6 | 15.5 | 15.4 | 15.3 | 15.3 | 15.3 | 15.3 | 15.2 | 15.2 | 15.2 |
| Etha | S6 | S5 | S8 | BT | C90 | Lbtran | Sw | M40t90 | Lbstat |
| 11.8 | 12.4 | 12.6 | 12.7 | 12.8 | 13 | 13 | 13.1 | 13.1 | 13.1 |