| Start Page |
|
 |
| Start Page |
|
|
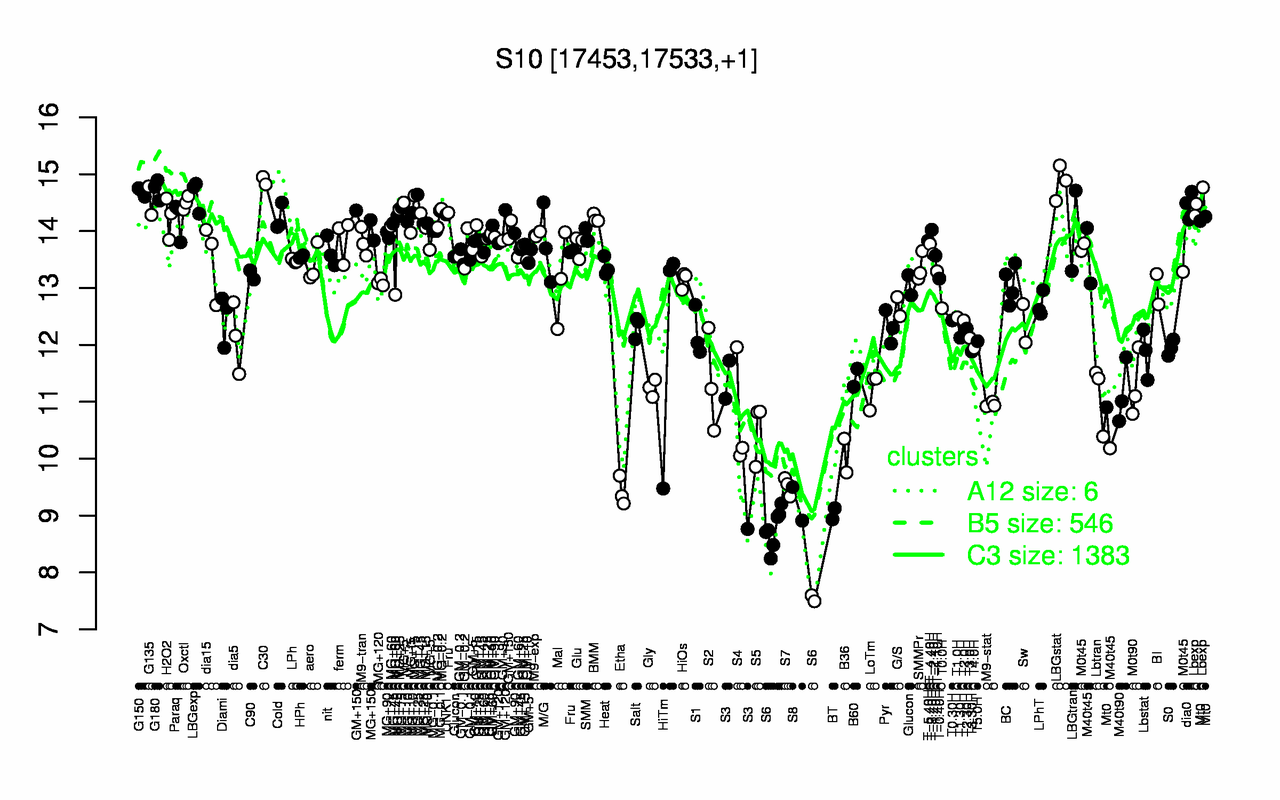
| C30 | LBGstat | G180 | G150 | LBGexp | G135 | Lbexp | Oxctl | dia0 | MG+25 |
| 14.9 | 14.9 | 14.7 | 14.7 | 14.6 | 14.5 | 14.5 | 14.5 | 14.5 | 14.4 |
| S6 | BT | S8 | Etha | S7 | B36 | S5 | S3 | S4 | M9-stat |
| 8.5 | 9.03 | 9.21 | 9.42 | 9.52 | 10.1 | 10.5 | 10.5 | 10.7 | 11 |