B. subtilis Expression Data Browser
Start Page
B. subtilis Expression Data Browser
Gene/Segment:
bofC
Locus Tag:
BSU27750
Details about bofC
Show/Hide
Highest Expression Conditions
Etha
S3
S8
S6
S4
S7
Salt
S5
Sw
LPhT
14.1
12.5
12.5
12.4
12.4
12.3
12.2
12.2
11.8
11.6
Lowest Expression Conditions
C90
LBGexp
M/G
aero
C30
HPh
Cold
MG+60
T-0.40H
MG+150
7.85
7.94
8.07
8.07
8.12
8.18
8.2
8.37
8.4
8.41
Most Positively Correlated Segments
S1050
katX
yfhE
yojJ
ywlB
yaaH
S1409
yhcM
S1136
yfkD
0.9
0.84
0.83
0.83
0.83
0.83
0.82
0.81
0.8
0.8
Most Negatively Correlated Segments
S1366
S10
rnc
ggaA
ftsE
rghRA
ycbN
dacA
S1567
yfkL
-0.77
-0.77
-0.76
-0.76
-0.75
-0.75
-0.75
-0.75
-0.74
-0.74
Expression Profile of Segment bofC
Show/Hide
Annotation of Gene bofC
Show/Hide
function
16.13: Shape
inference
ab initio prediction:AMIGene:2.0
codon_start
1
product
Bypass of forespore C, intercompartmental signaling factor
transl_table
11
note
Evidence 1a: Function experimentally demonstrated in the studied strain; PubMedId: 10931291, 16049010; Product type f: factor
db_xref
GI:2635240
protein_id
CAB14735.1
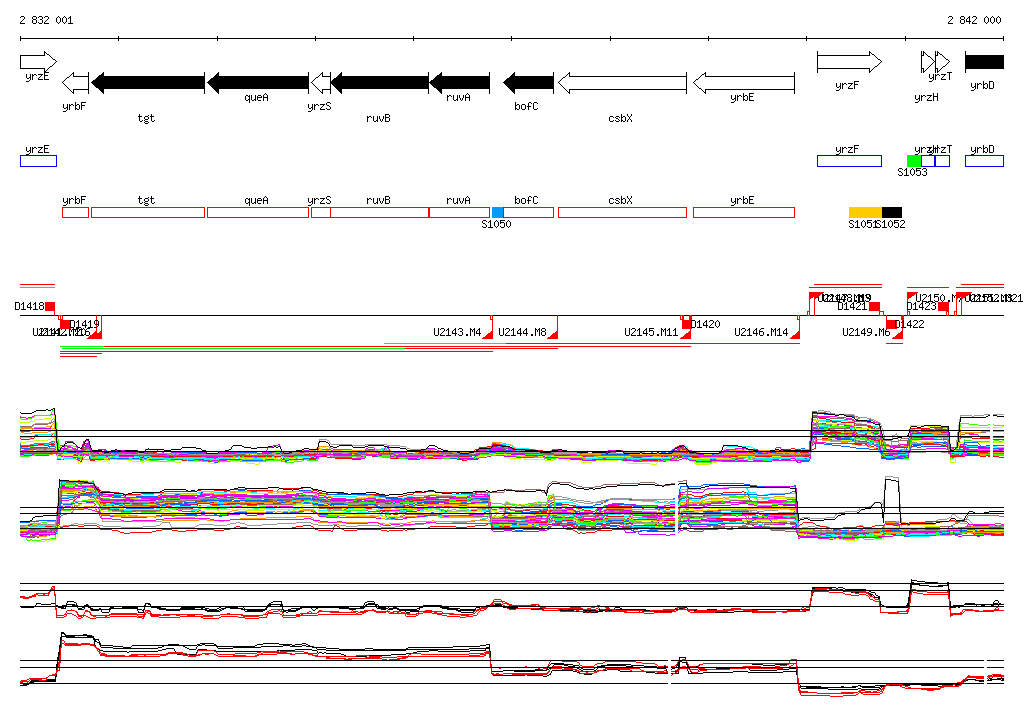
Genomic View of Gene/Segment bofC
Show/Hide
(Legend)
Browse Genome Context