B. subtilis Expression Data Browser
Start Page
B. subtilis Expression Data Browser
Gene/Segment:
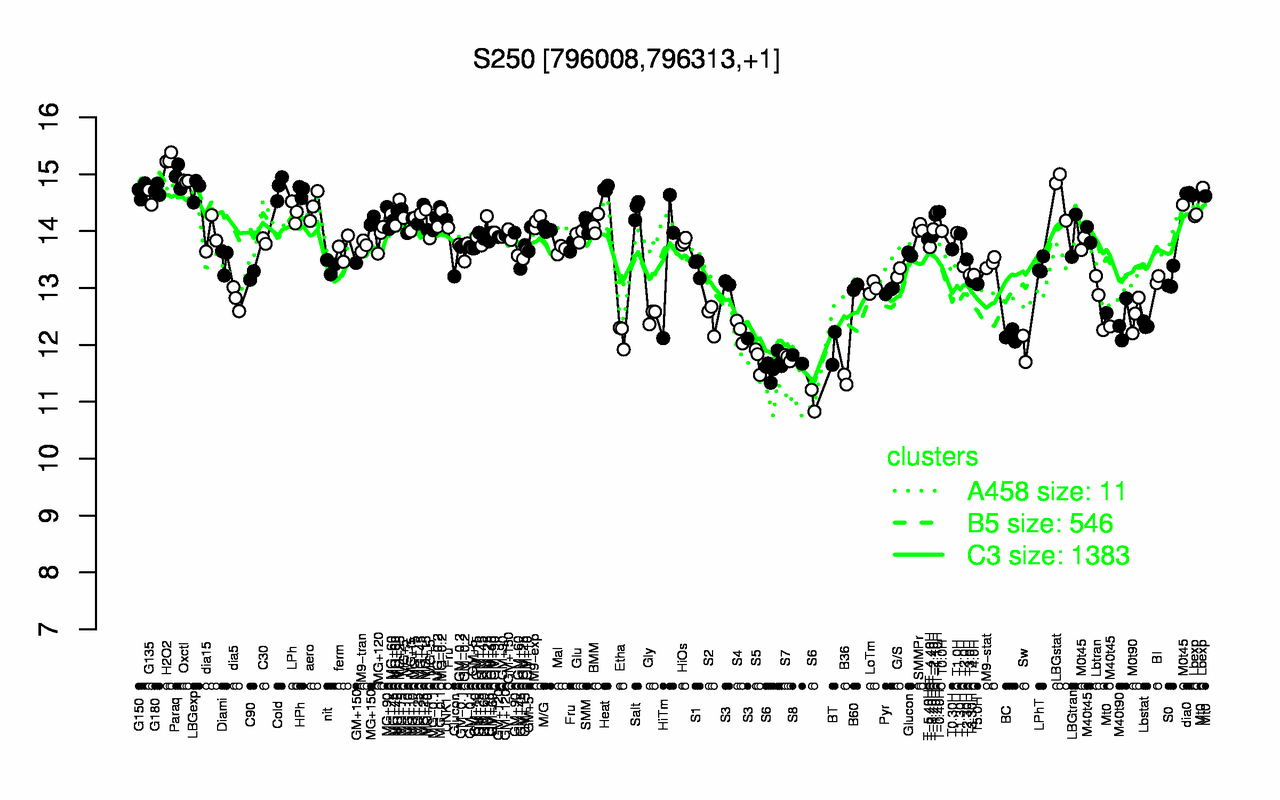
S250
Locus Tag:
new_796008_796313
Details about S250
Show/Hide
Highest Expression Conditions
H2O2
Paraq
Oxctl
Cold
Heat
LBGexp
G180
G150
HPh
LBGstat
15.3
15
14.9
14.8
14.7
14.7
14.7
14.7
14.7
14.7
Lowest Expression Conditions
B36
S6
S5
S8
S7
Sw
BT
BC
Etha
S4
11.4
11.5
11.7
11.7
11.8
11.9
11.9
12.2
12.2
12.2
Most Positively Correlated Segments
ltaSA
S7
S1037
S10
mreB
yhcE
S43
yrrM
S64
rnpA
0.92
0.89
0.87
0.87
0.87
0.87
0.87
0.87
0.86
0.86
Most Negatively Correlated Segments
sigF
yhzD
spoIIAB
fadN
S402
fadE
fadA
spoIIAA
S545
ybbC
-0.78
-0.78
-0.77
-0.77
-0.76
-0.76
-0.76
-0.75
-0.75
-0.75
Expression Profile of Segment S250
Show/Hide
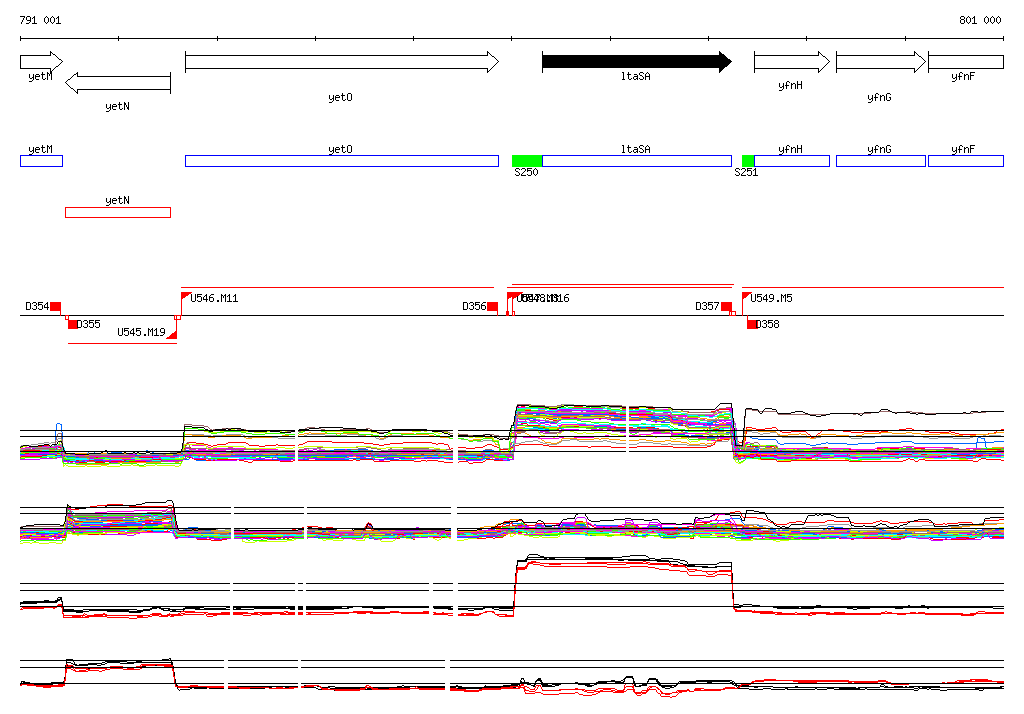
Genomic View of Gene/Segment S250
Show/Hide
(Legend)
Browse Genome Context