| Start Page |
|
 |
| Start Page |
|
|
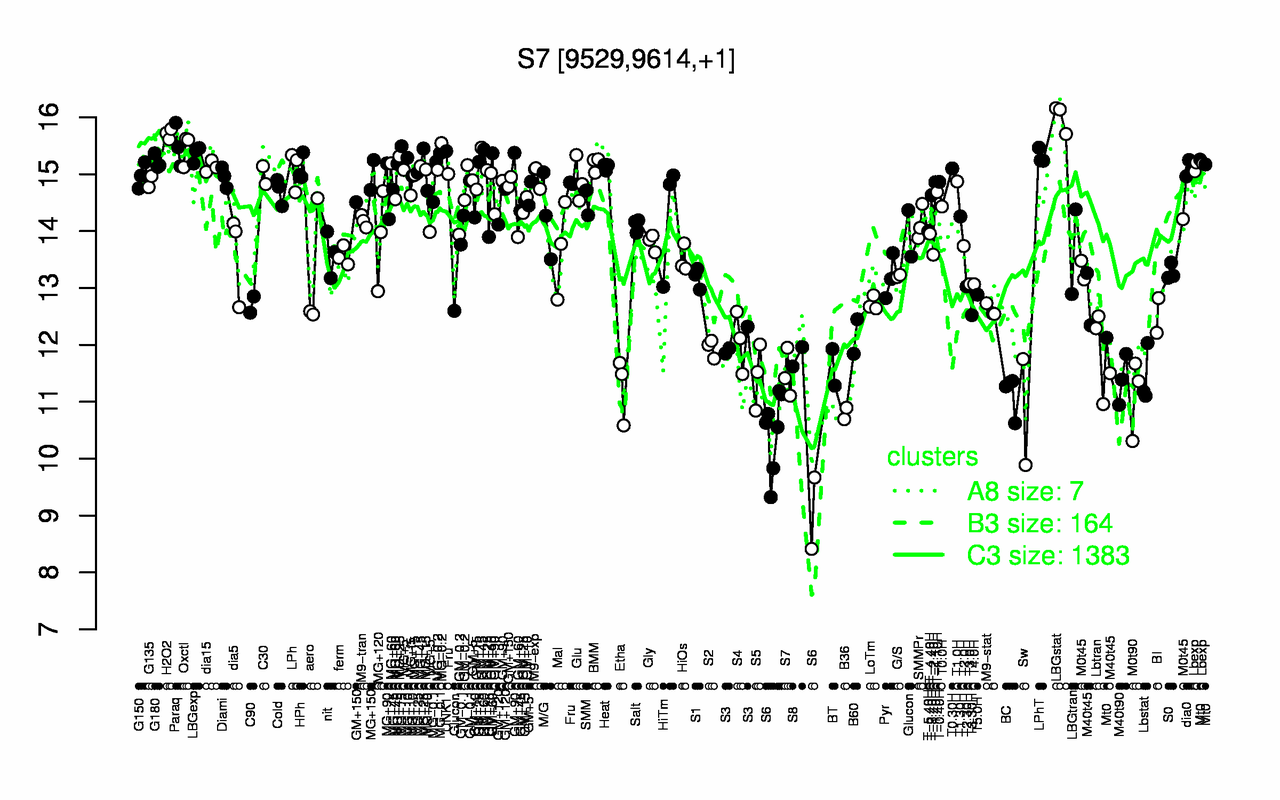
| LBGstat | H2O2 | Paraq | Oxctl | UNK1 | LBGexp | LPhT | MG-0.2 | MG+25 | G180 |
| 16 | 15.7 | 15.5 | 15.5 | 15.4 | 15.4 | 15.3 | 15.3 | 15.3 | 15.2 |
| S6 | B36 | Sw | M0t90 | BC | Etha | M40t90 | Lbstat | S5 | S7 |
| 10.2 | 10.8 | 10.8 | 11.1 | 11.1 | 11.3 | 11.4 | 11.4 | 11.5 | 11.5 |