B. subtilis Expression Data Browser
Start Page
B. subtilis Expression Data Browser
Gene/Segment:
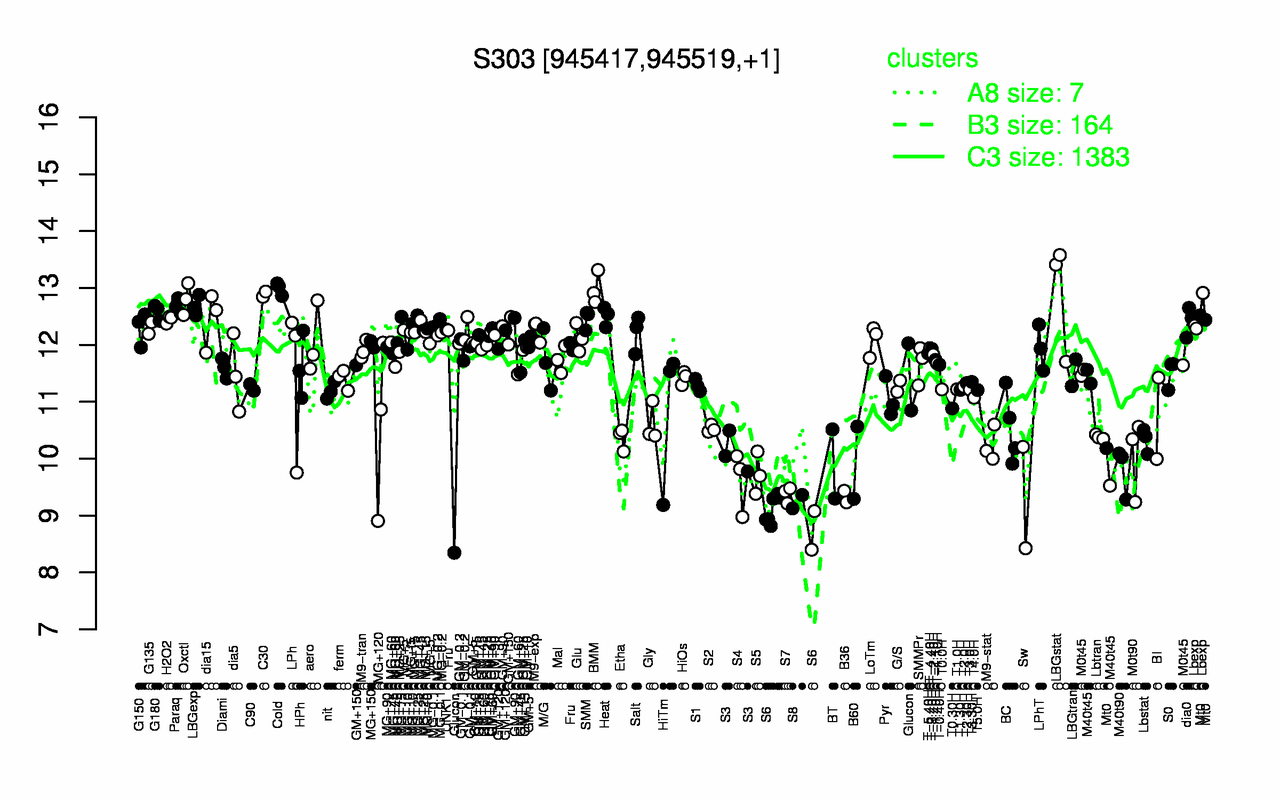
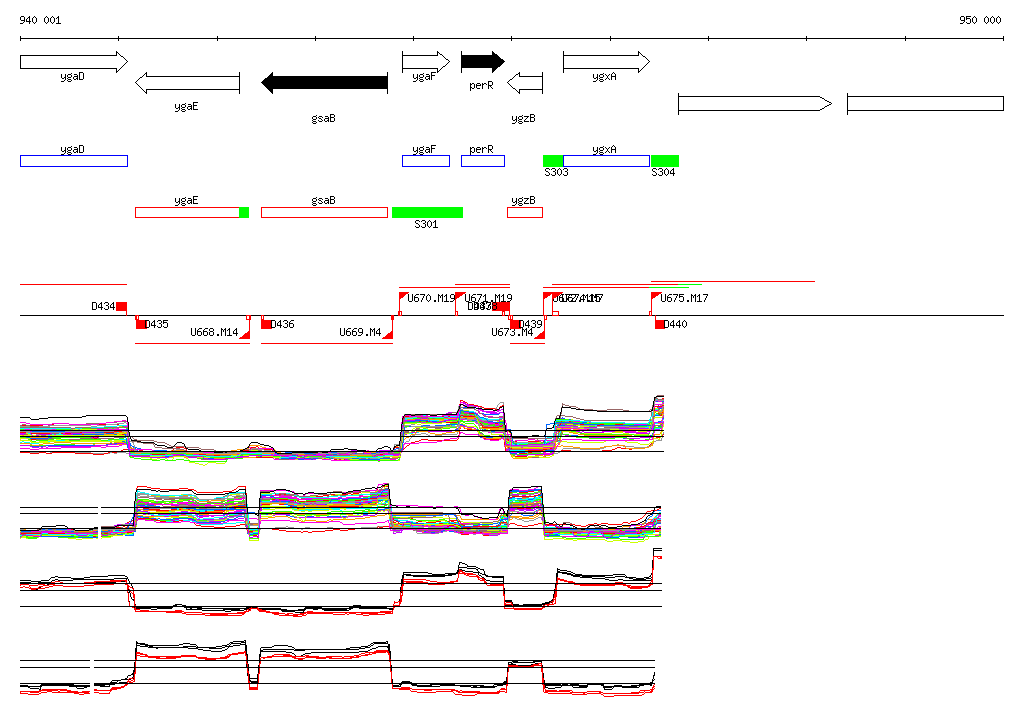
S303
Locus Tag:
new_945417_945519
Details about S303
Show/Hide
Highest Expression Conditions
BMM
Cold
LBGstat
C30
Oxctl
LBGexp
Paraq
G180
Lbexp
Heat
13
13
12.9
12.9
12.8
12.7
12.7
12.6
12.5
12.5
Lowest Expression Conditions
S6
S8
Sw
B36
S7
S4
S5
M40t90
BT
B60
9.05
9.24
9.32
9.33
9.37
9.61
9.74
9.8
9.91
9.93
Most Positively Correlated Segments
S7
S43
S250
S64
S10
S1142
S581
S199
S66
S917
0.86
0.86
0.85
0.85
0.83
0.82
0.82
0.82
0.82
0.81
Most Negatively Correlated Segments
fadN
fadA
fadE
yugN
yqhP
yccK
S1195
yobO
sspH
yknU
-0.77
-0.76
-0.76
-0.76
-0.75
-0.75
-0.75
-0.74
-0.74
-0.74
Expression Profile of Segment S303
Show/Hide
Genomic View of Gene/Segment S303
Show/Hide
(Legend)
Browse Genome Context