| Start Page |
|
 |
| Start Page |
|
|
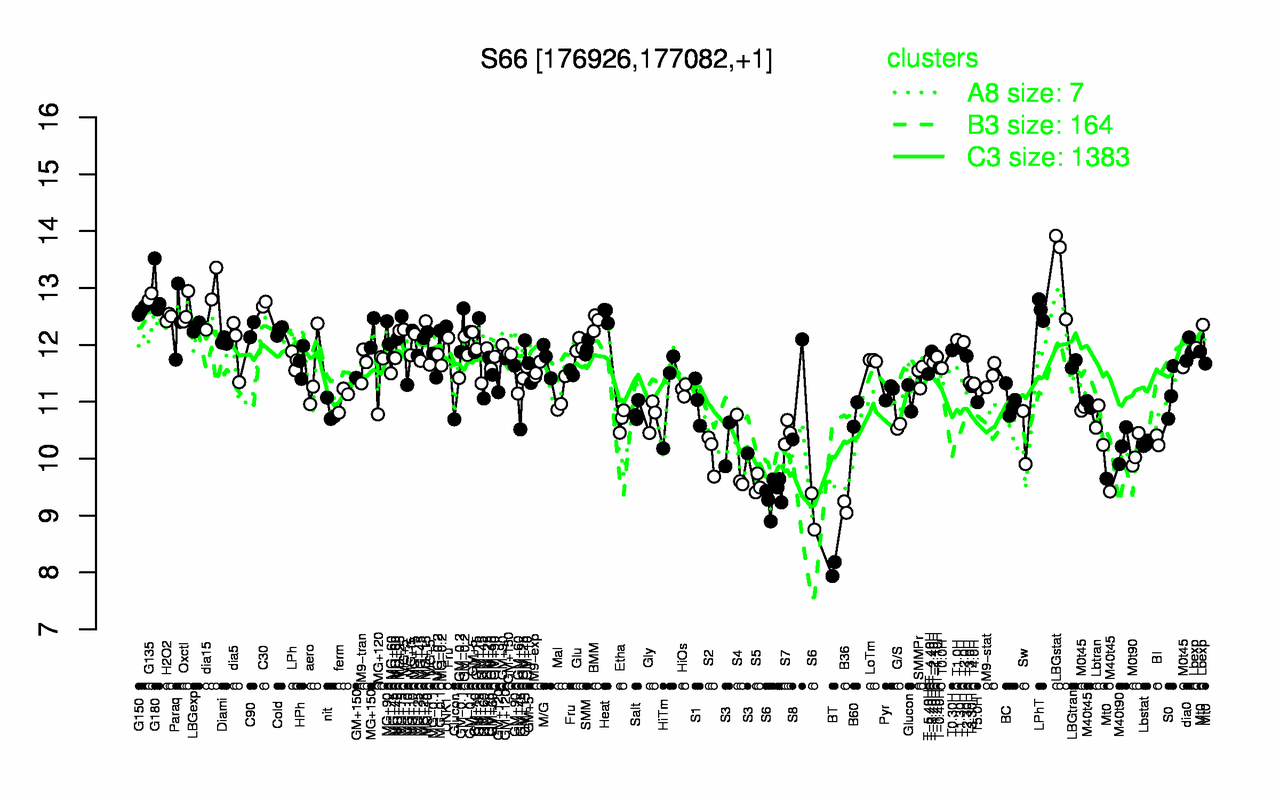
| LBGstat | G180 | G135 | dia15 | C30 | Oxctl | LPhT | G150 | Heat | H2O2 |
| 13.4 | 13 | 12.8 | 12.8 | 12.7 | 12.6 | 12.6 | 12.6 | 12.5 | 12.5 |
| BT | B36 | S6 | S5 | S4 | S2 | M0t90 | S3 | M40t90 | Lbstat |
| 8.06 | 9.15 | 9.31 | 9.55 | 9.98 | 10.1 | 10.1 | 10.2 | 10.2 | 10.3 |