| Start Page |
|
 |
| Start Page |
|
|
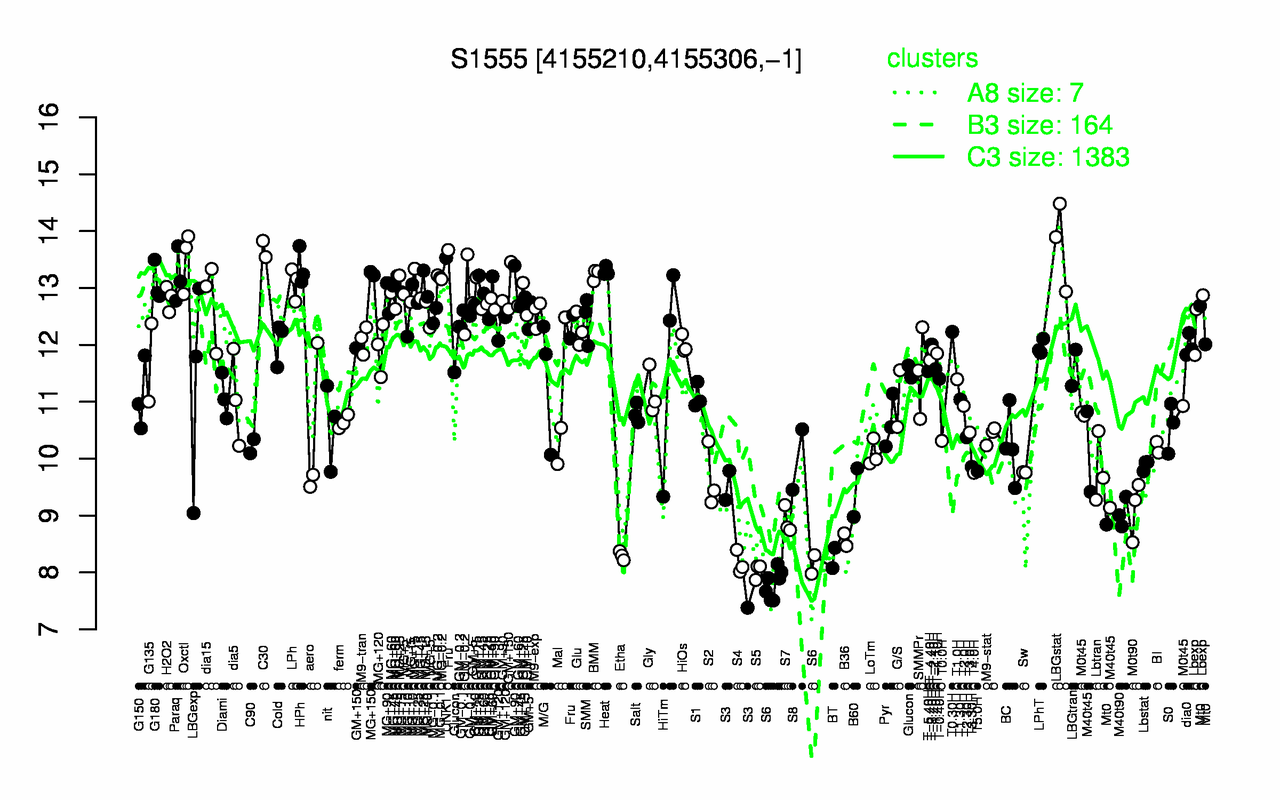
| LBGstat | C30 | UNK1 | Oxctl | HPh | Heat | MG+150 | BMM | Paraq | MG-0.2 |
| 13.8 | 13.7 | 13.5 | 13.5 | 13.4 | 13.3 | 13.3 | 13.2 | 13.2 | 13.2 |
| S6 | S5 | S4 | BT | Etha | B36 | S3 | S7 | M40t90 | M0t90 |
| 7.88 | 8.03 | 8.17 | 8.26 | 8.3 | 8.58 | 8.81 | 8.91 | 9.05 | 9.11 |