B. subtilis Expression Data Browser
Start Page
B. subtilis Expression Data Browser
Gene/Segment:
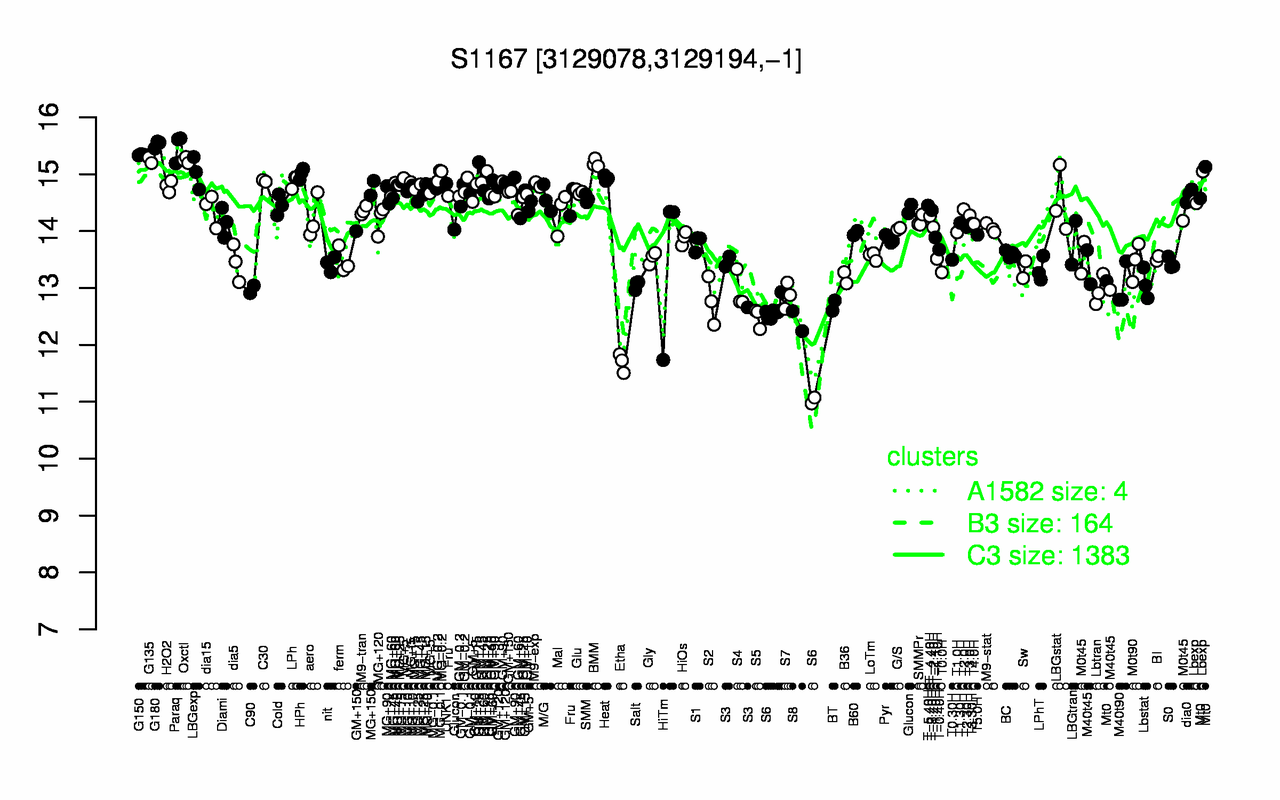
S1167
Locus Tag:
new_3129078_3129194_c
Details about S1167
Show/Hide
Highest Expression Conditions
G180
Paraq
G150
Oxctl
G135
BMM
LBGexp
HPh
MG-0.2
GM+25
15.5
15.5
15.3
15.2
15.2
15.2
15
15
15
15
Lowest Expression Conditions
Etha
S6
S8
S5
BT
S2
S7
S4
Lbtran
C90
11.7
12.3
12.4
12.5
12.7
12.8
12.9
13
13
13
Most Positively Correlated Segments
NA
S10
S43
S64
S1166
trmB
murE
S1555
S250
S1089
0.99
0.86
0.86
0.85
0.85
0.84
0.84
0.84
0.84
0.84
Most Negatively Correlated Segments
yhzD
yccK
phrG
ymzB
ypiB
yqaC
yqhQ
yvaM
S1112
yqhP
-0.76
-0.76
-0.74
-0.73
-0.73
-0.73
-0.72
-0.72
-0.71
-0.71
Expression Profile of Segment S1167
Show/Hide
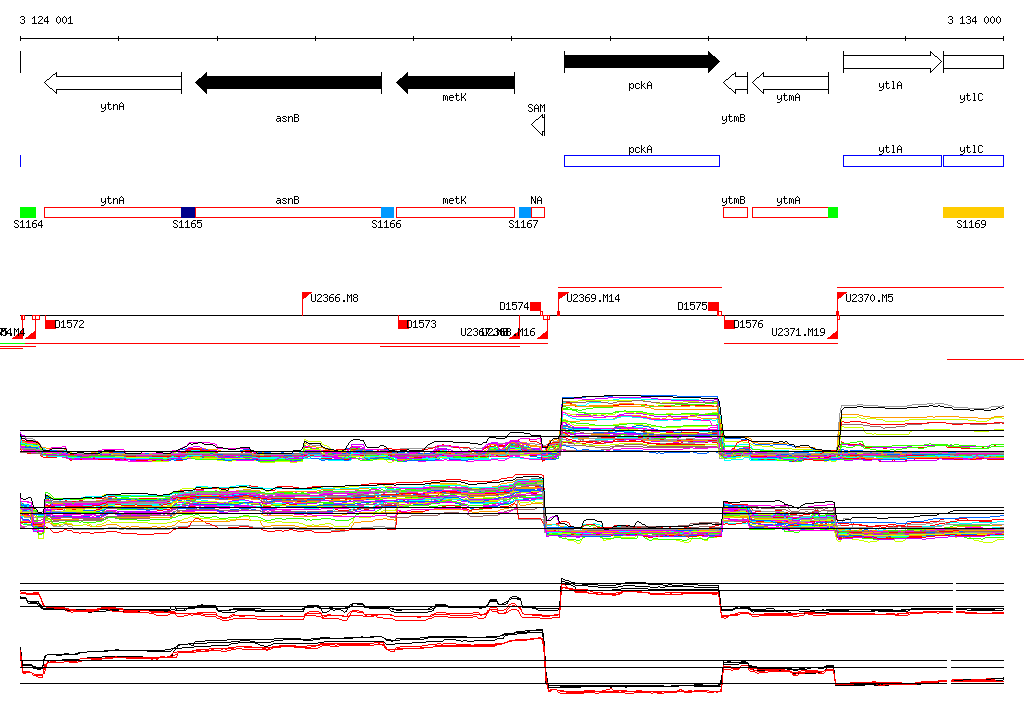
Genomic View of Gene/Segment S1167
Show/Hide
(Legend)
Browse Genome Context