B. subtilis Expression Data Browser
Start Page
B. subtilis Expression Data Browser
Gene/Segment:
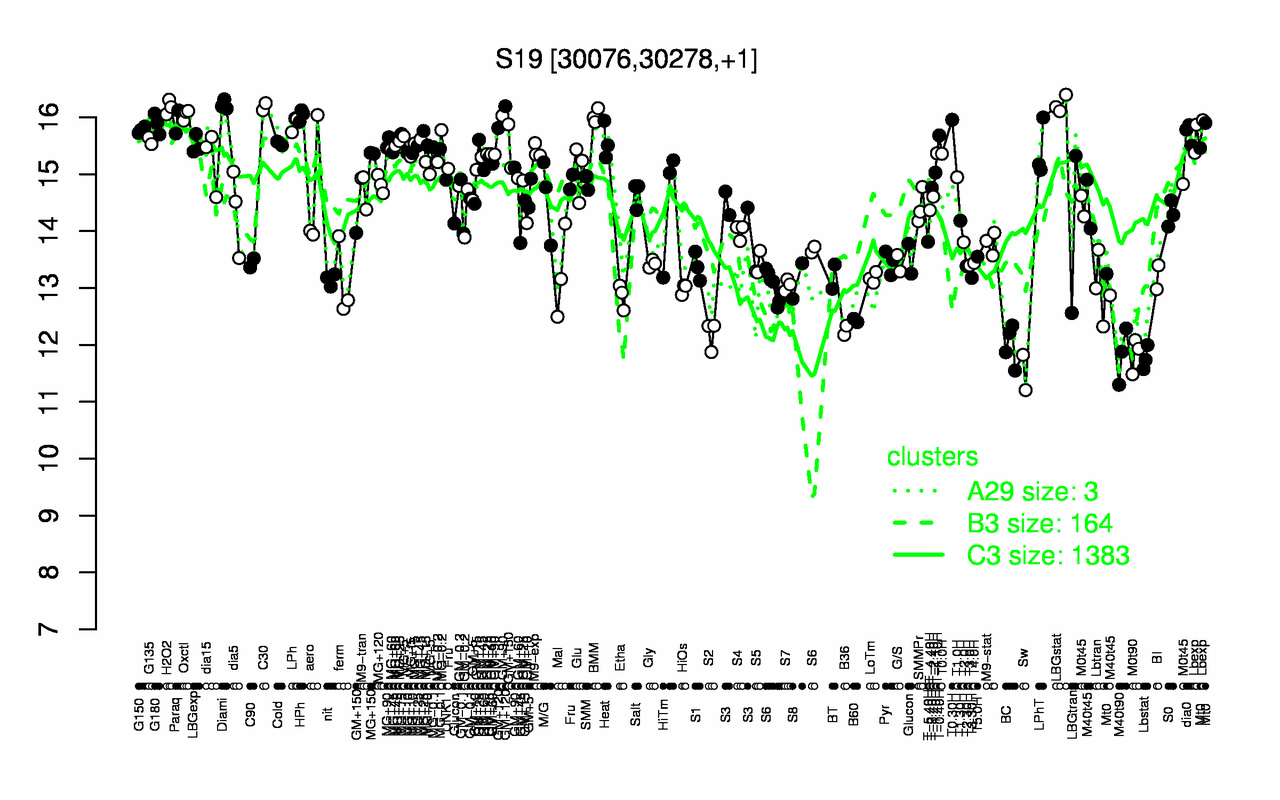
S19
Locus Tag:
new_30076_30278
Details about S19
Show/Hide
Highest Expression Conditions
LBGstat
Diami
C30
H2O2
Oxctl
HPh
BMM
GM+120
Paraq
T0.30H
16.2
16.2
16.2
16.2
16
16
16
16
16
16
Lowest Expression Conditions
Sw
Lbstat
M40t90
M0t90
BC
S2
B36
B60
Etha
HiOs
11.5
11.8
11.8
11.8
12
12.2
12.3
12.4
12.9
13
Most Positively Correlated Segments
S1181
S7
S43
S64
S304
S1452
ywnC
rsmE
S204
S1037
0.92
0.85
0.84
0.84
0.84
0.83
0.81
0.81
0.81
0.8
Most Negatively Correlated Segments
dacC
yoxA
phrG
yisT
dhaS
yukJ
qcrB
S725
ypiB
qcrC
-0.82
-0.8
-0.79
-0.78
-0.78
-0.78
-0.76
-0.76
-0.76
-0.76
Expression Profile of Segment S19
Show/Hide
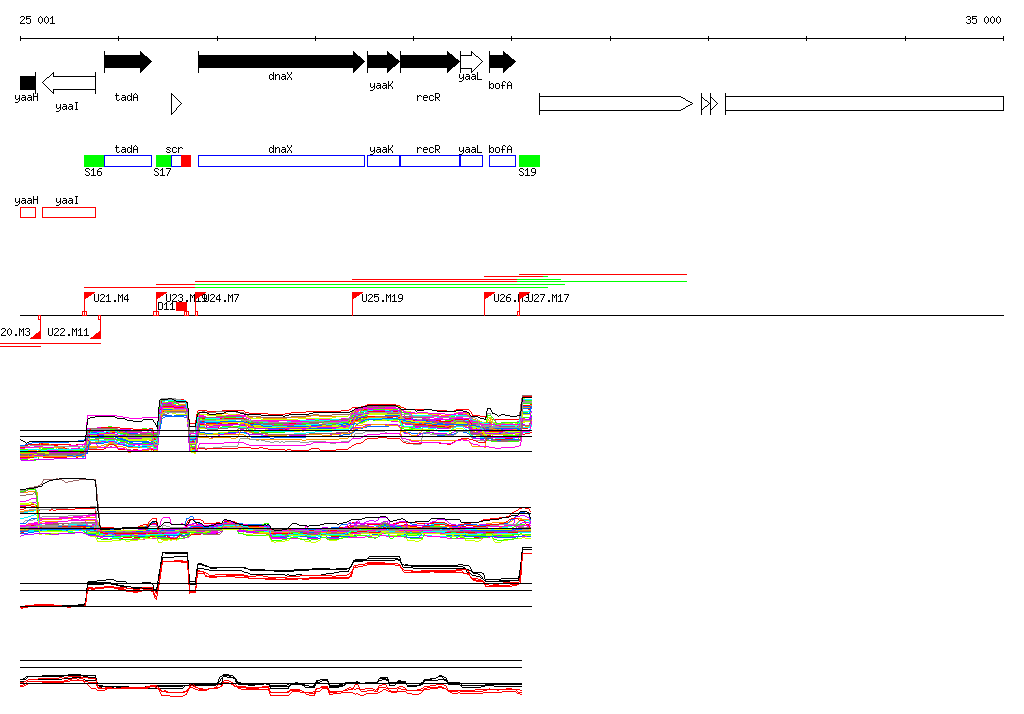
Genomic View of Gene/Segment S19
Show/Hide
(Legend)
Browse Genome Context