B. subtilis Expression Data Browser
Details about S1052 Show/Hide
Highest Expression Conditions
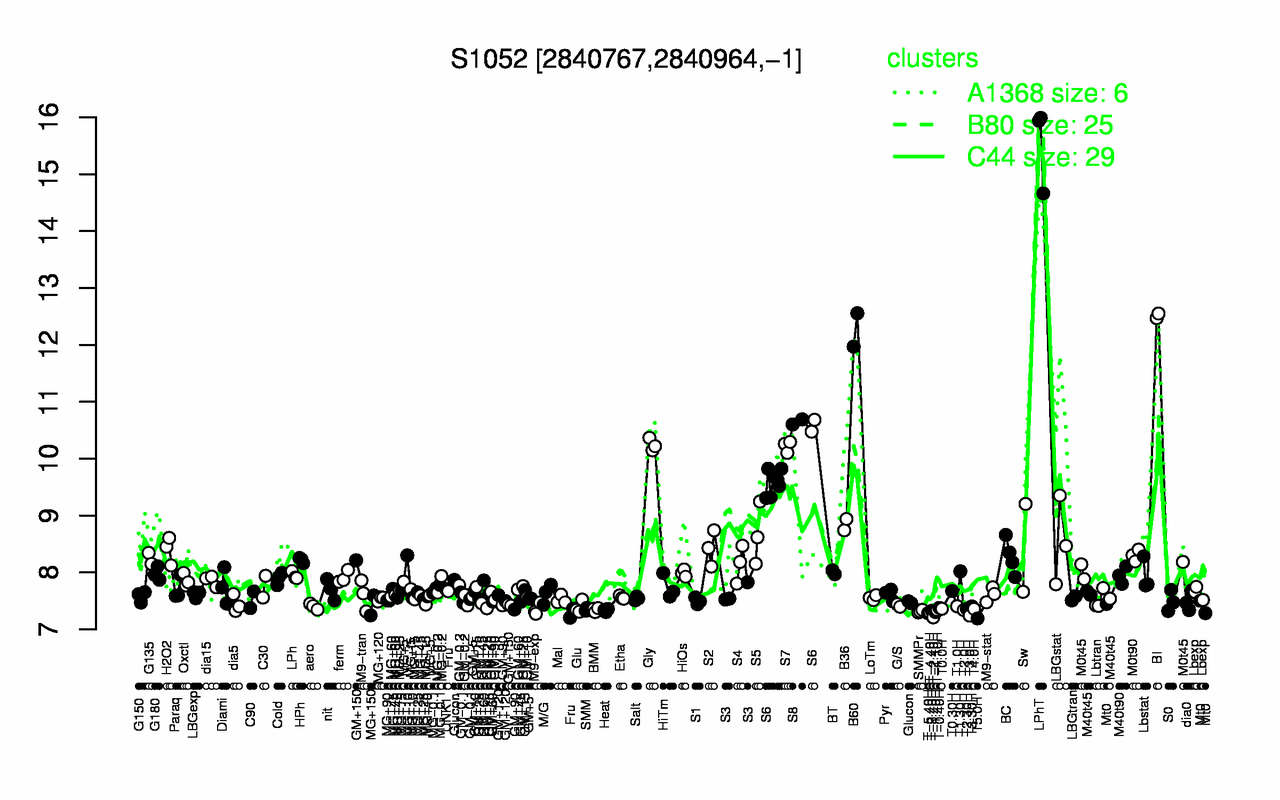
LPhT BI B60 S8 Gly S7 S6 B36 S5 LBGstat
15.5 12.5 12.3 10.6 10.2 10.2 9.81 8.84 8.67 8.54
Lowest Expression Conditions
T5.0H T-2.40H T3.0H T-5.40H T-4.40H T-1.40H SMMPr T-3.40H Heat T2.0H
7.19 7.21 7.24 7.29 7.3 7.3 7.32 7.32 7.33 7.34
Most Positively Correlated Segments
pstA tuaA pstC tuaA pstBB S1051 pstBA pstS tuaB tuaC
0.86 0.86 0.86 0.85 0.85 0.85 0.85 0.84 0.83 0.83
Most Negatively Correlated Segments
accB fabD S859 hepS accC fabG S1139 plsX proB glnA
-0.6 -0.58 -0.57 -0.56 -0.54 -0.54 -0.54 -0.53 -0.53 -0.53
Expression Profile of Segment S1052 Show/Hide
Genomic View of Gene/Segment S1052 Show/Hide
(Legend)