B. subtilis Expression Data Browser
Start Page
B. subtilis Expression Data Browser
Gene/Segment:
pstA
Locus Tag:
BSU24970
Details about pstA
Show/Hide
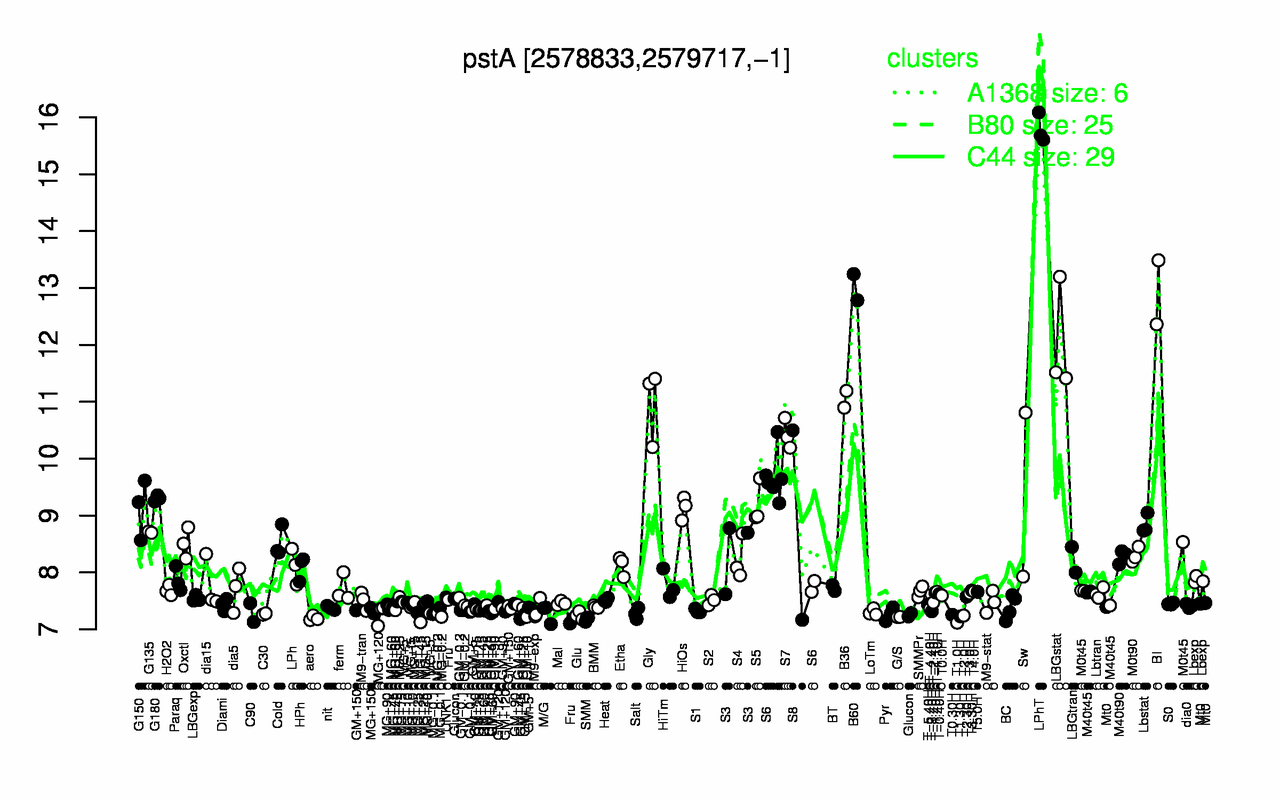
Highest Expression Conditions
LPhT
B60
BI
LBGstat
B36
Gly
S7
Sw
G180
S6
15.8
13
12.9
12
11
11
10.4
9.37
9.3
9.24
Lowest Expression Conditions
T1.0H
SMM
aero
G/S
T1.30H
T2.0H
Glu
MG-0.2
T0.30H
MG+120
7.12
7.18
7.2
7.22
7.23
7.24
7.25
7.25
7.26
7.27
Most Positively Correlated Segments
pstC
pstBA
pstS
pstBB
S1052
tuaB
tuaA
tuaC
tuaA
tuaD
0.99
0.99
0.98
0.98
0.86
0.84
0.84
0.84
0.83
0.82
Most Negatively Correlated Segments
NA
S859
S1068
S1139
wprA
glnA
ysoA
yknX
proB
S85
-0.52
-0.52
-0.52
-0.51
-0.51
-0.5
-0.49
-0.49
-0.49
-0.48
Expression Profile of Segment pstA
Show/Hide
Annotation of Gene pstA
Show/Hide
function
16.1: Circulate
inference
ab initio prediction:AMIGene:2.0
codon_start
1
product
phosphate ABC transporter (permease)
transl_table
11
note
Evidence 1a: Function experimentally demonstrated in the studied strain; PubMedId: 12897025, 15289558, 15849754, 16850406, 9098050; Product type t : transporter
db_xref
GI:225185192
protein_id
CAB14427.2
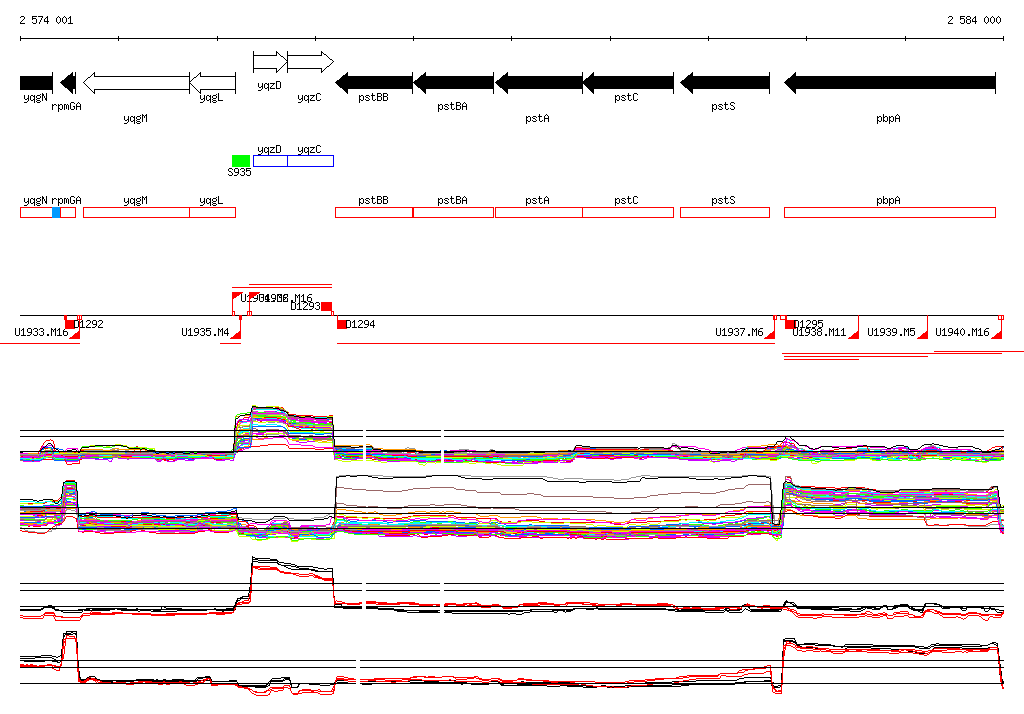
Genomic View of Gene/Segment pstA
Show/Hide
(Legend)
Browse Genome Context