| Start Page |
|
 |
| Start Page |
|
|
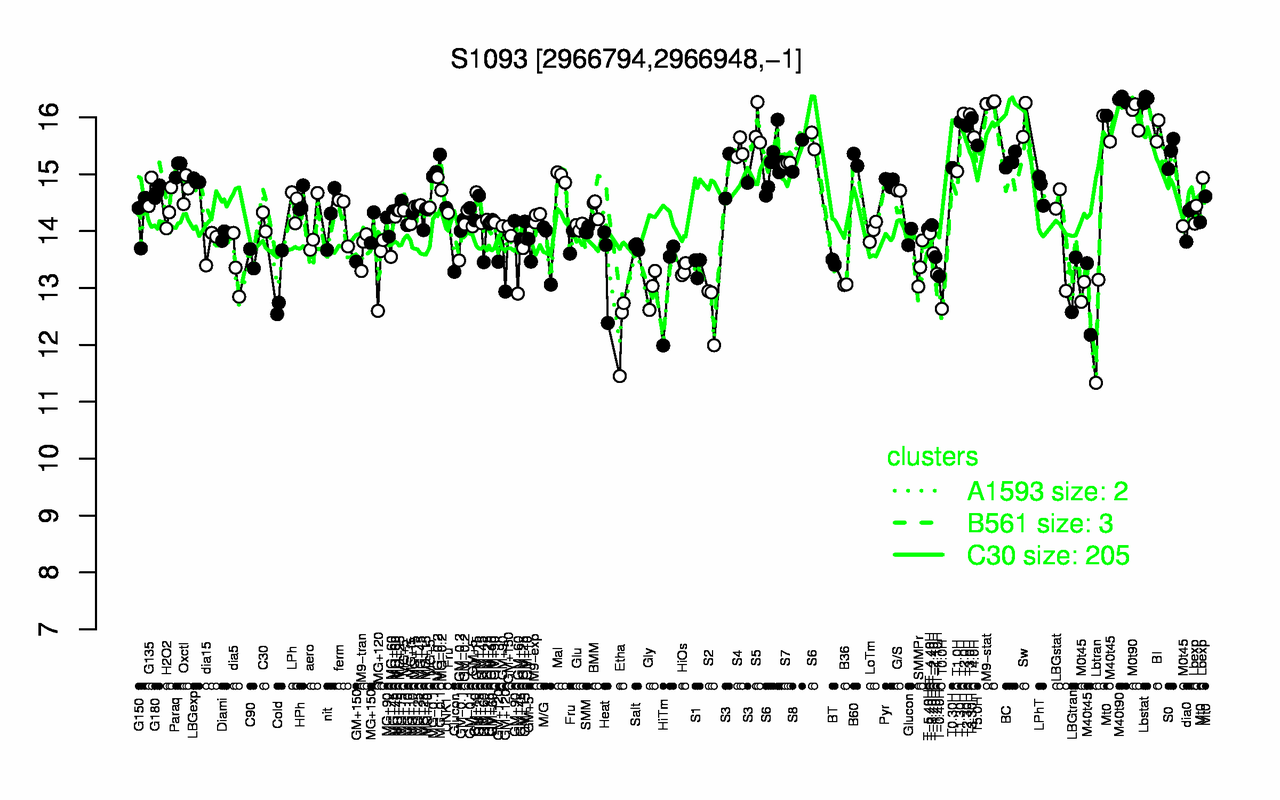
| Lbstat | M40t90 | M9-stat | T2.0H | T3.0H | M0t90 | T3.30H | Sw | T1.30H | T2.30H |
| 16.3 | 16.3 | 16.3 | 16.1 | 16.1 | 16 | 16 | 16 | 15.9 | 15.9 |
| Etha | S2 | T0.0H | Cold | Gly | LBGtran | B36 | HiTm | GM+120 | T-0.40H |
| 12.3 | 12.6 | 12.6 | 13 | 13 | 13.1 | 13.1 | 13.1 | 13.2 | 13.2 |