| Start Page |
|
 |
| Start Page |
|
|
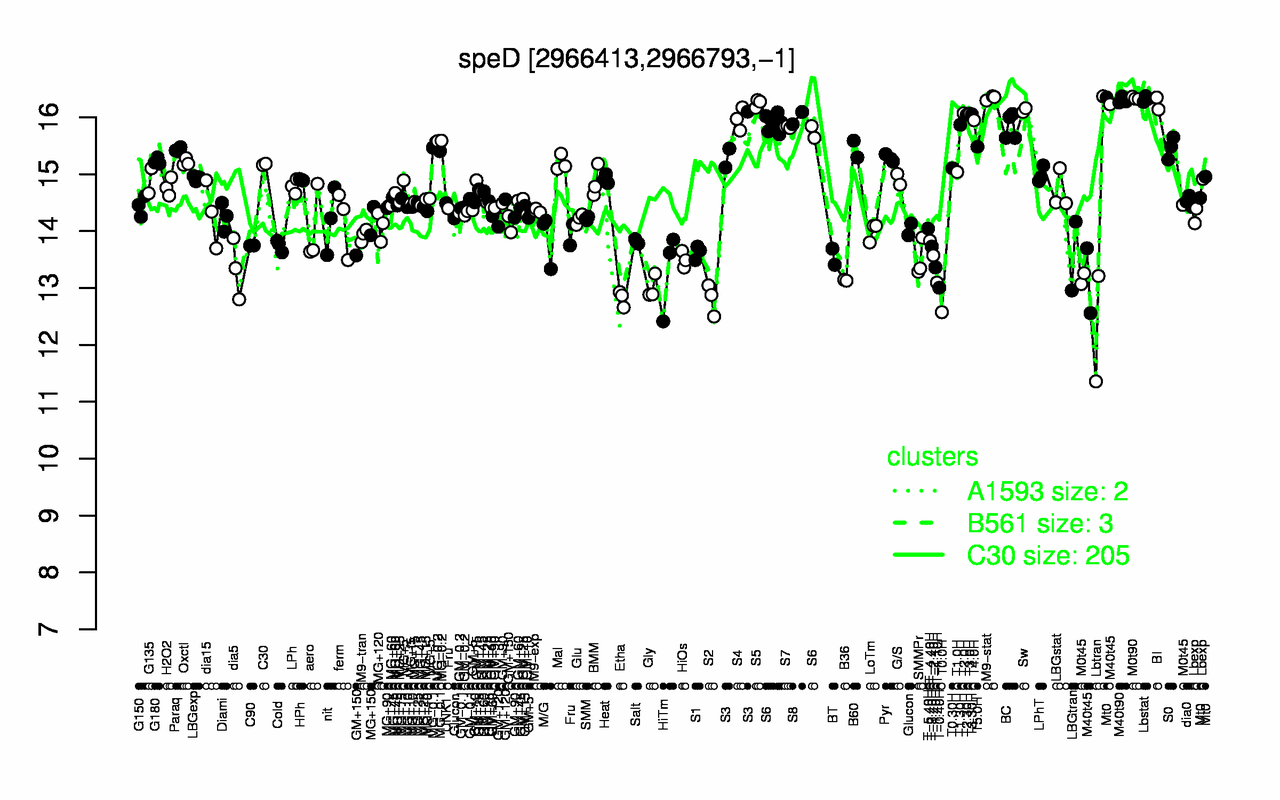
| M9-stat | M0t90 | Lbstat | M40t90 | S5 | BI | Sw | T2.0H | T3.0H | T3.30H |
| 16.3 | 16.3 | 16.3 | 16.3 | 16.2 | 16.2 | 16.1 | 16.1 | 16.1 | 16.1 |
| T0.0H | S2 | Etha | T-0.40H | Gly | T-1.10H | B36 | HiTm | dia5 | T-1.40H |
| 12.6 | 12.8 | 12.8 | 13 | 13 | 13.1 | 13.1 | 13.3 | 13.3 | 13.4 |