| Start Page |
|
 |
| Start Page |
|
|
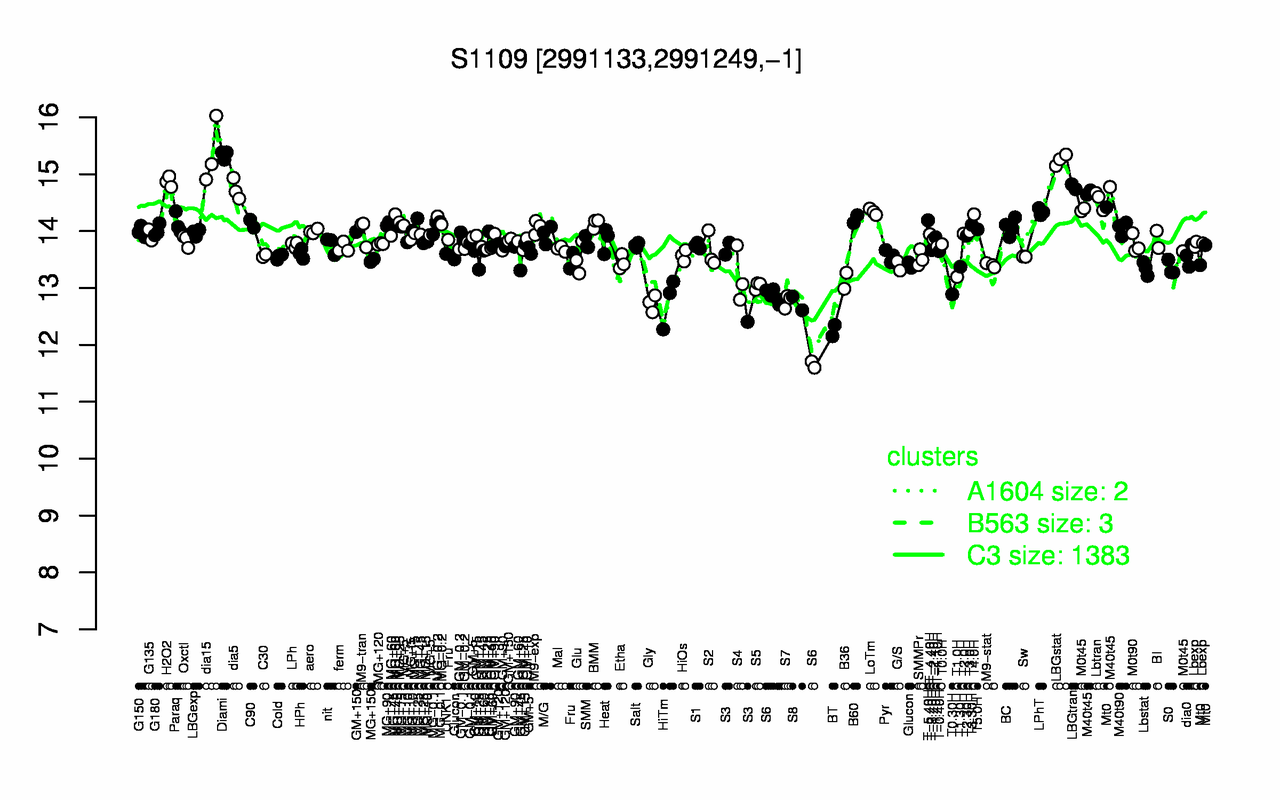
| dia15 | Diami | LBGstat | H2O2 | LBGtran | dia5 | M40t45 | Lbtran | LPhT | LoTm |
| 15.4 | 15.3 | 15.3 | 14.9 | 14.8 | 14.7 | 14.7 | 14.5 | 14.3 | 14.3 |
| BT | S6 | S8 | Gly | HiTm | S7 | T0.30H | S5 | B36 | T1.0H |
| 12.3 | 12.6 | 12.7 | 12.7 | 12.8 | 12.8 | 12.9 | 13 | 13.1 | 13.2 |