| Start Page |
|
 |
| Start Page |
|
|
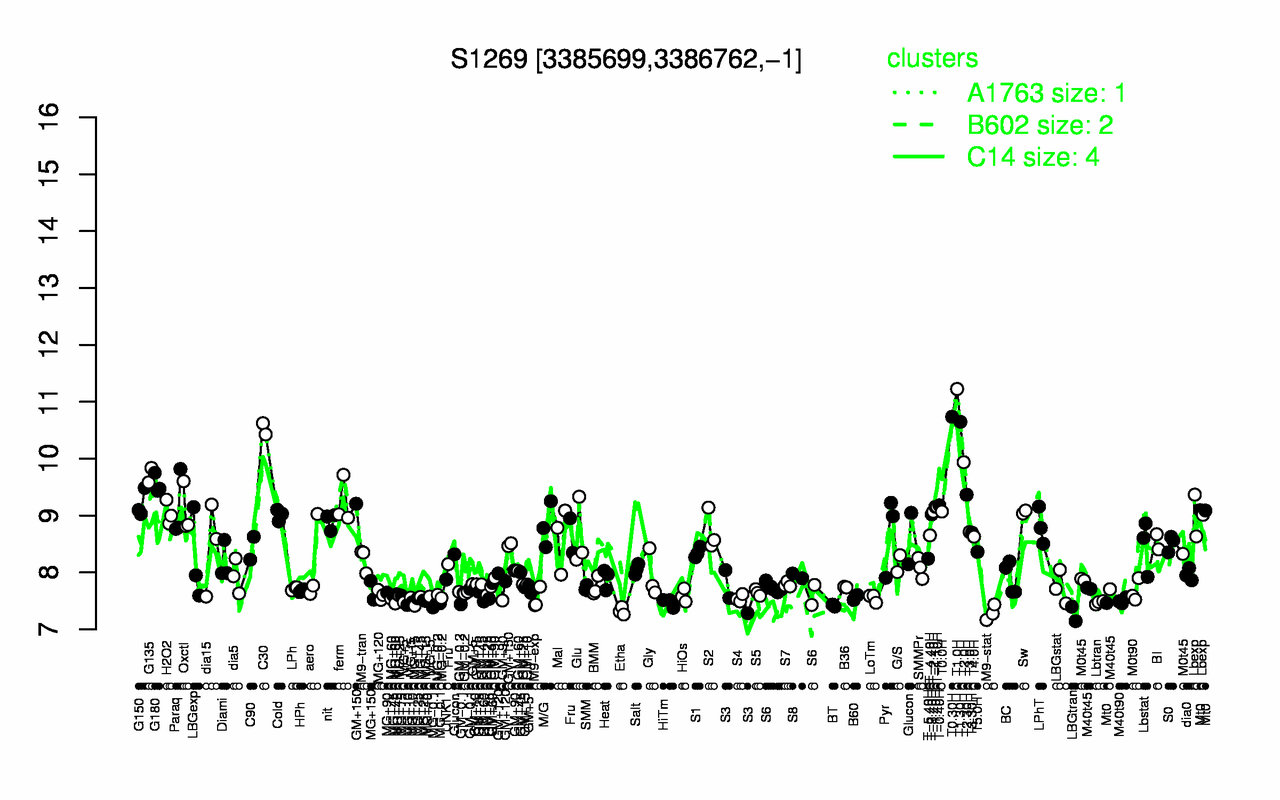
| T1.0H | T0.30H | T1.30H | C30 | T2.0H | G135 | G180 | T2.30H | ferm | G150 |
| 11.2 | 10.7 | 10.6 | 10.5 | 9.94 | 9.71 | 9.55 | 9.37 | 9.23 | 9.2 |
| LBGtran | M9-stat | Etha | BT | MG-0.1 | MG+10 | HiTm | Lbtran | MG+60 | MG+15 |
| 7.27 | 7.29 | 7.32 | 7.42 | 7.43 | 7.47 | 7.47 | 7.47 | 7.5 | 7.5 |