| Start Page |
|
 |
| Start Page |
|
|
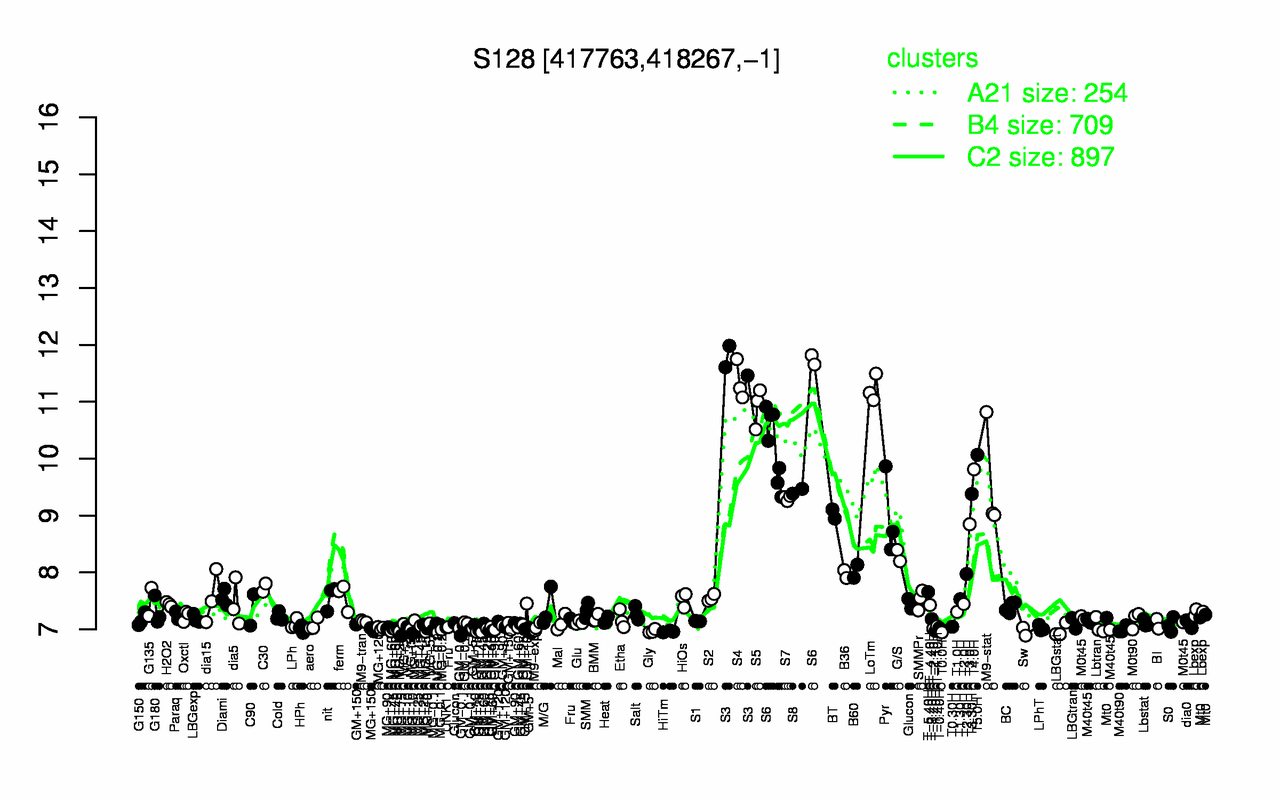
| S3 | S4 | LoTm | S5 | S6 | T5.0H | T4.0H | M9-stat | S8 | T3.30H |
| 11.7 | 11.4 | 11.2 | 10.9 | 10.6 | 10.1 | 9.81 | 9.62 | 9.43 | 9.38 |
| T0.0H | Sw | HiTm | Gly | MG-0.2 | T-1.40H | GM+15 | MG+60 | LBGstat | GM-0.1 |
| 6.95 | 6.96 | 6.96 | 6.97 | 6.97 | 6.97 | 6.98 | 6.98 | 6.98 | 6.98 |