| Start Page |
|
 |
| Start Page |
|
|
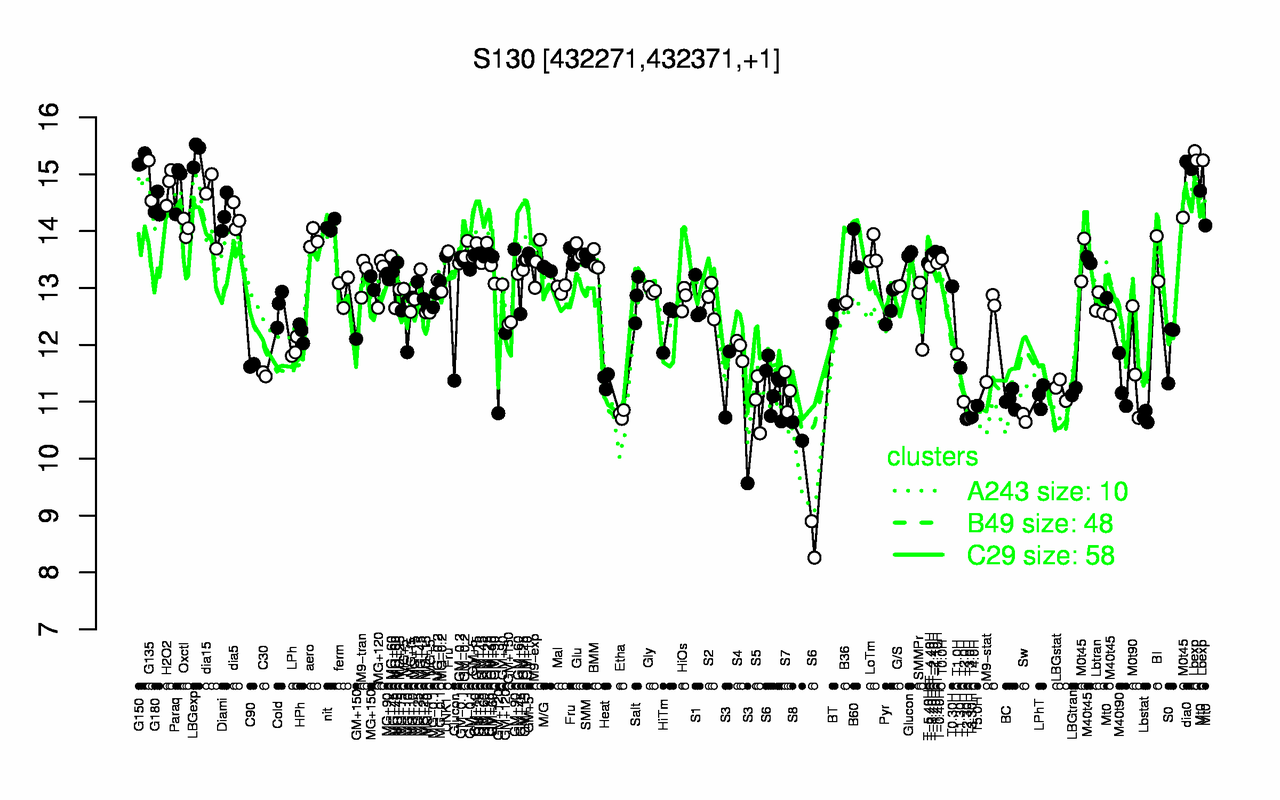
| LBGexp | Lbexp | G150 | dia0 | G135 | H2O2 | Paraq | dia15 | G180 | Diami |
| 15.4 | 15.3 | 15.2 | 15.2 | 14.9 | 14.8 | 14.8 | 14.4 | 14.4 | 14.3 |
| S8 | S6 | T2.30H | Sw | T3.0H | S3 | T3.30H | Lbstat | Etha | T4.0H |
| 10.5 | 10.6 | 10.7 | 10.7 | 10.7 | 10.7 | 10.7 | 10.7 | 10.8 | 10.9 |