| Start Page |
|
 |
| Start Page |
|
|
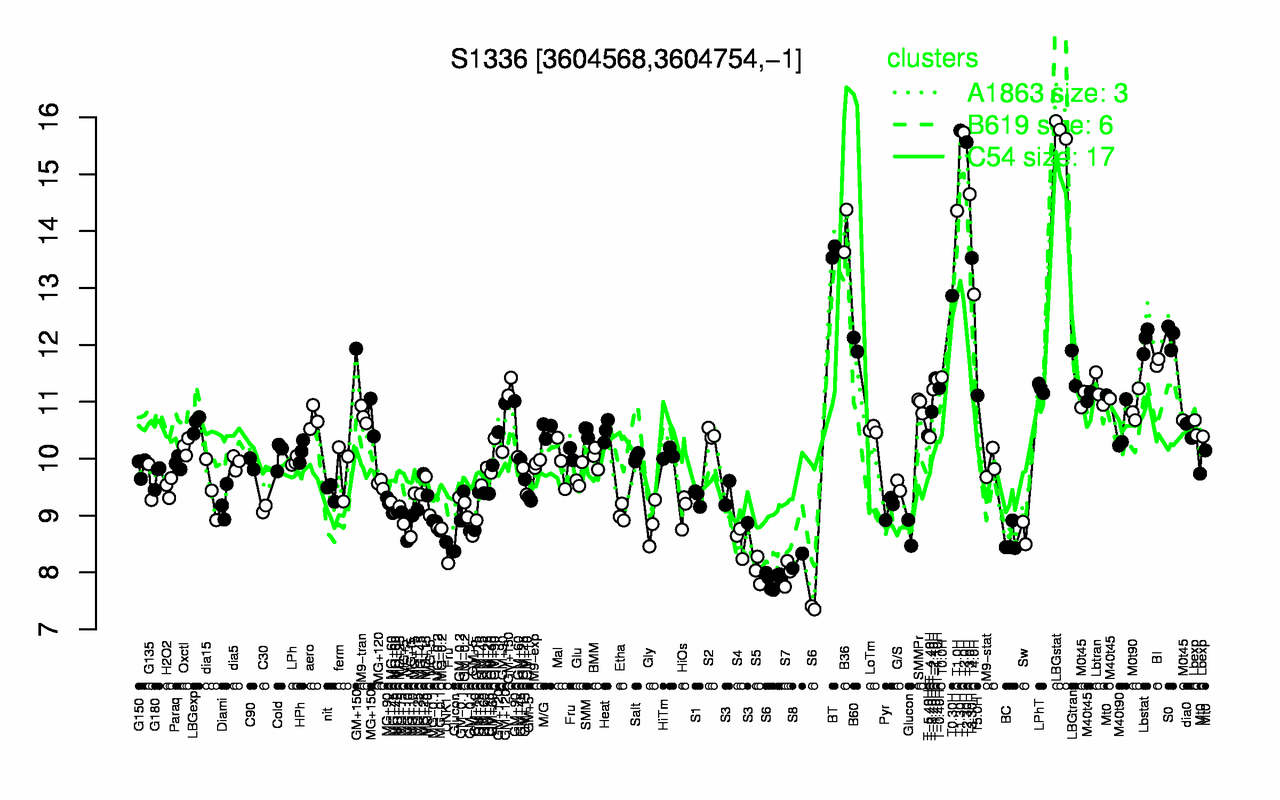
| LBGstat | T1.30H | T2.0H | T2.30H | T3.0H | T1.0H | B36 | BT | T3.30H | T4.0H |
| 15.8 | 15.8 | 15.7 | 15.6 | 14.6 | 14.4 | 14 | 13.6 | 13.5 | 12.9 |
| S6 | S7 | S5 | S8 | UNK1 | S4 | BC | Glucon | MG+t5 | Sw |
| 7.76 | 7.99 | 8.03 | 8.2 | 8.53 | 8.55 | 8.56 | 8.59 | 8.62 | 8.69 |