| Start Page |
|
 |
| Start Page |
|
|
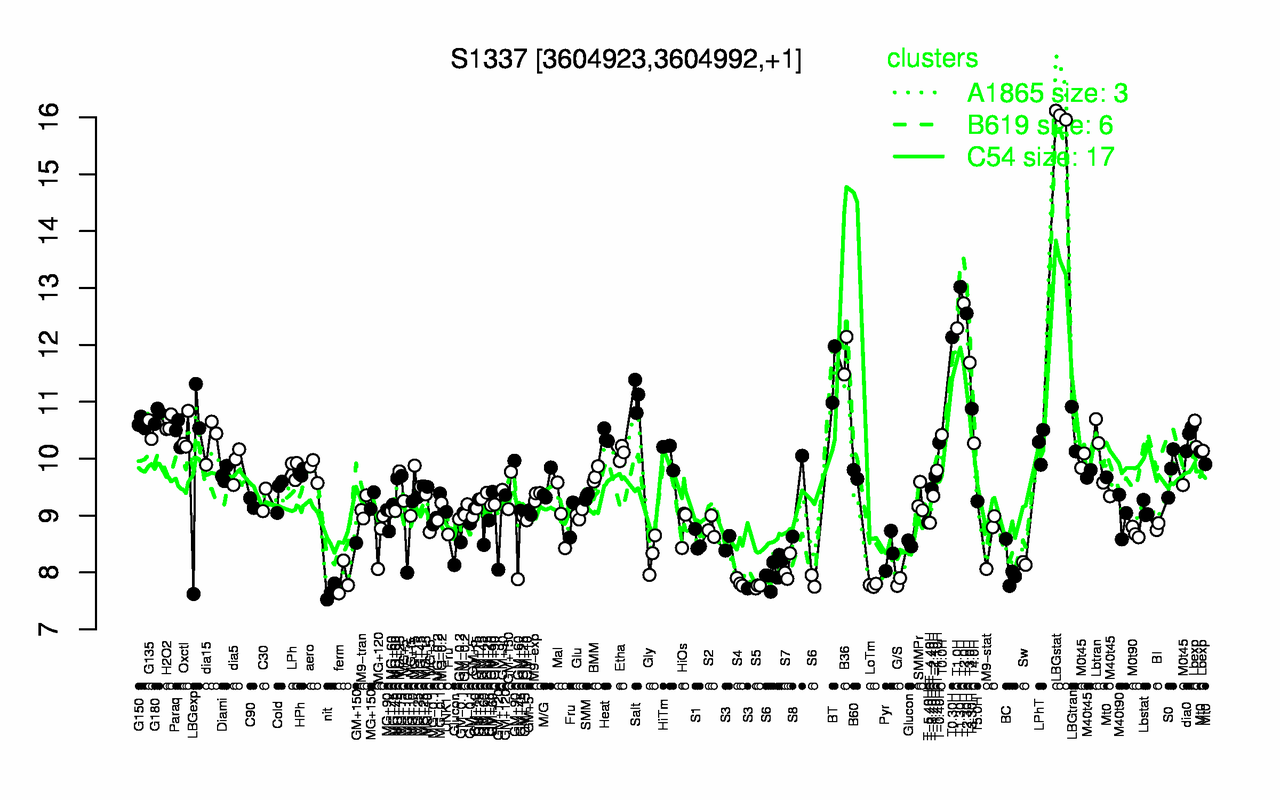
| LBGstat | T1.30H | T2.0H | T2.30H | T1.0H | T0.30H | B36 | T3.0H | BT | Salt |
| 16 | 13 | 12.7 | 12.6 | 12.3 | 12.1 | 11.8 | 11.7 | 11.5 | 11.1 |
| nit | S5 | LoTm | S4 | G/S | ferm | S6 | S7 | BC | Sw |
| 7.66 | 7.75 | 7.78 | 7.83 | 7.83 | 7.87 | 7.98 | 8.07 | 8.08 | 8.16 |