| Start Page |
|
 |
| Start Page |
|
|
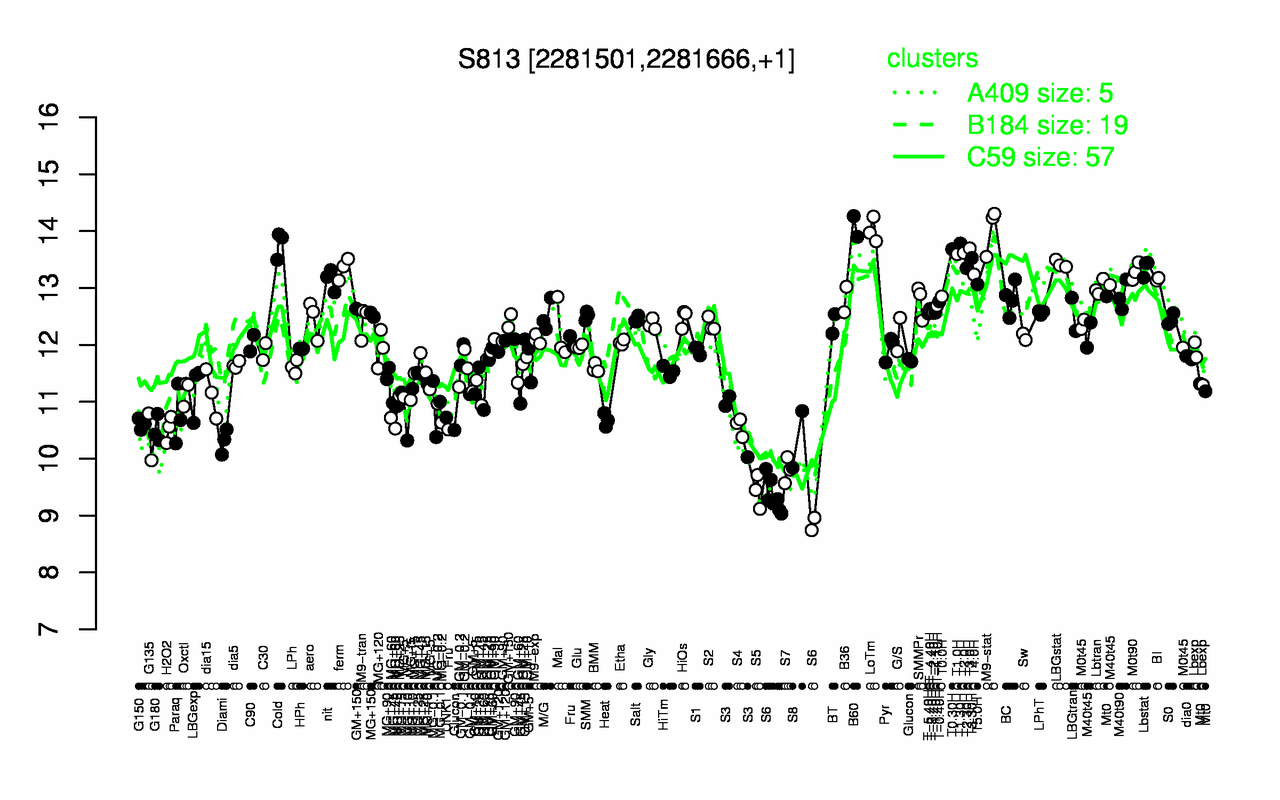
| B60 | M9-stat | LoTm | T1.30H | Cold | T3.0H | T0.30H | T2.0H | T1.0H | T3.30H |
| 14.1 | 14 | 14 | 13.8 | 13.8 | 13.7 | 13.7 | 13.6 | 13.6 | 13.5 |
| S6 | S5 | S7 | Diami | S8 | G135 | G180 | H2O2 | S4 | G150 |
| 9.23 | 9.43 | 9.8 | 10.3 | 10.3 | 10.4 | 10.5 | 10.5 | 10.6 | 10.6 |