| Start Page |
|
 |
| Start Page |
|
|
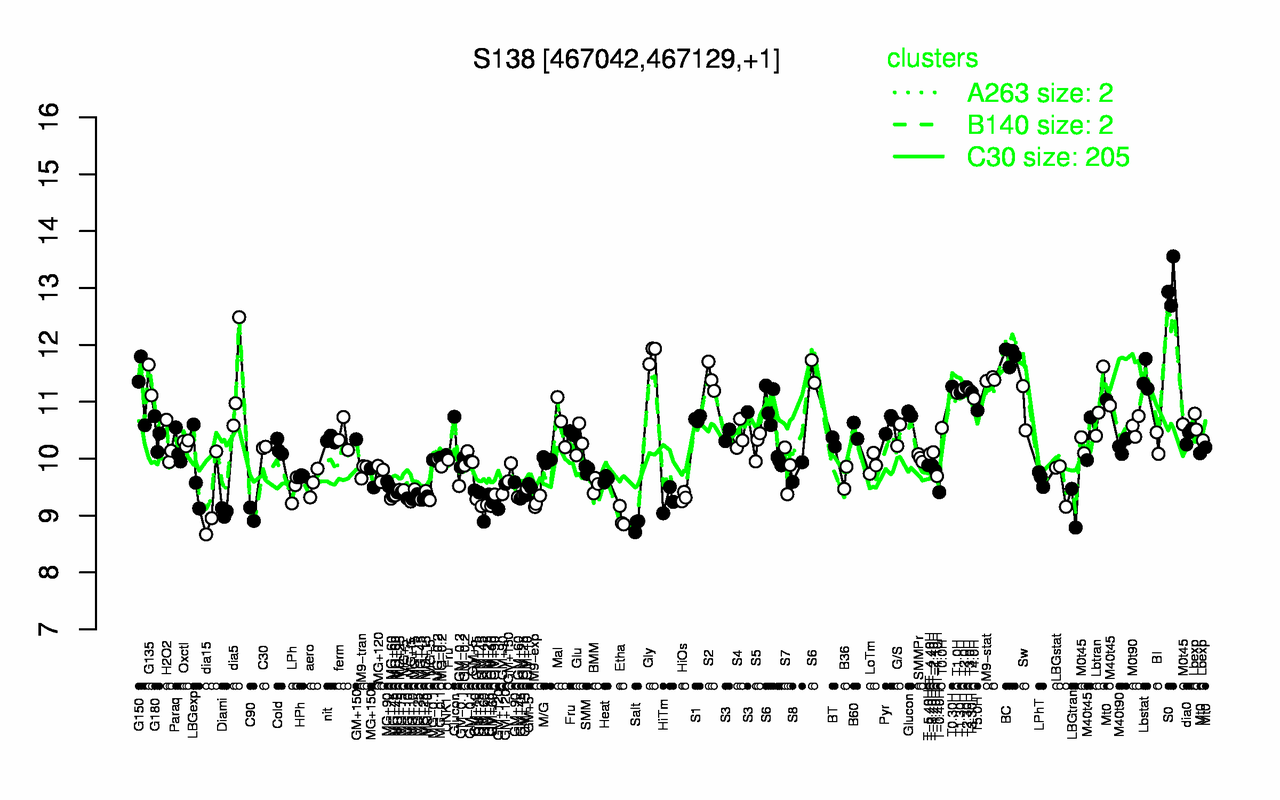
| S0 | Gly | BC | Lbstat | S2 | M9-stat | G135 | dia5 | T0.30H | T2.30H |
| 13.1 | 11.8 | 11.8 | 11.4 | 11.4 | 11.4 | 11.4 | 11.3 | 11.3 | 11.3 |
| Salt | Etha | C90 | Diami | LBGtran | GM+60 | GM+45 | M9-exp | MG+t5 | dia15 |
| 8.83 | 8.96 | 9.02 | 9.06 | 9.13 | 9.15 | 9.21 | 9.24 | 9.25 | 9.25 |