B. subtilis Expression Data Browser
Start Page
B. subtilis Expression Data Browser
Gene/Segment:
mtlR
Locus Tag:
BSU04160
Details about mtlR
Show/Hide
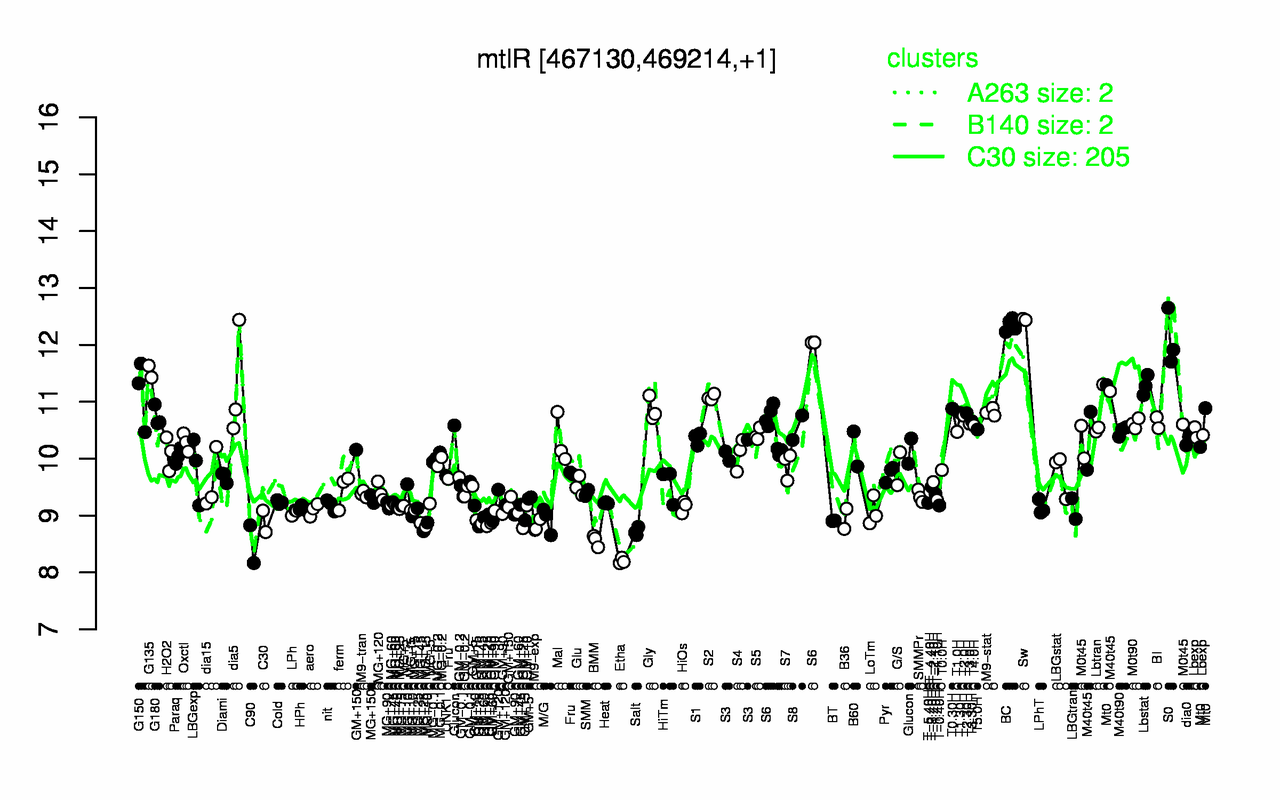
Highest Expression Conditions
Sw
BC
S0
G135
Lbstat
dia5
G150
S2
T0.30H
Gly
12.4
12.3
12.1
11.5
11.3
11.3
11.2
11.1
10.9
10.9
Lowest Expression Conditions
Etha
C90
BMM
Salt
GM+25
M9-exp
C30
BT
M/G
B36
8.2
8.5
8.56
8.72
8.8
8.82
8.9
8.91
8.93
8.94
Most Positively Correlated Segments
S138
rbsK
bglS
rbsD
rbsA
cstA
yulD
rbsC
rbsB
yulE
0.86
0.83
0.83
0.82
0.81
0.81
0.81
0.8
0.8
0.8
Most Negatively Correlated Segments
serA
trpA
yosU
NA
S231
tyrA
hisC
opuAA
NA
S236
-0.61
-0.61
-0.6
-0.6
-0.6
-0.6
-0.59
-0.59
-0.58
-0.58
Expression Profile of Segment mtlR
Show/Hide
Annotation of Gene mtlR
Show/Hide
function
16.3: Control
inference
ab initio prediction:AMIGene:2.0
codon_start
1
product
transcriptional regulator
transl_table
11
note
Evidence 1a: Function experimentally demonstrated in the studied strain; PubMedId: 12897001; Product type r: regulator
db_xref
GI:2632716
protein_id
CAB12223.1
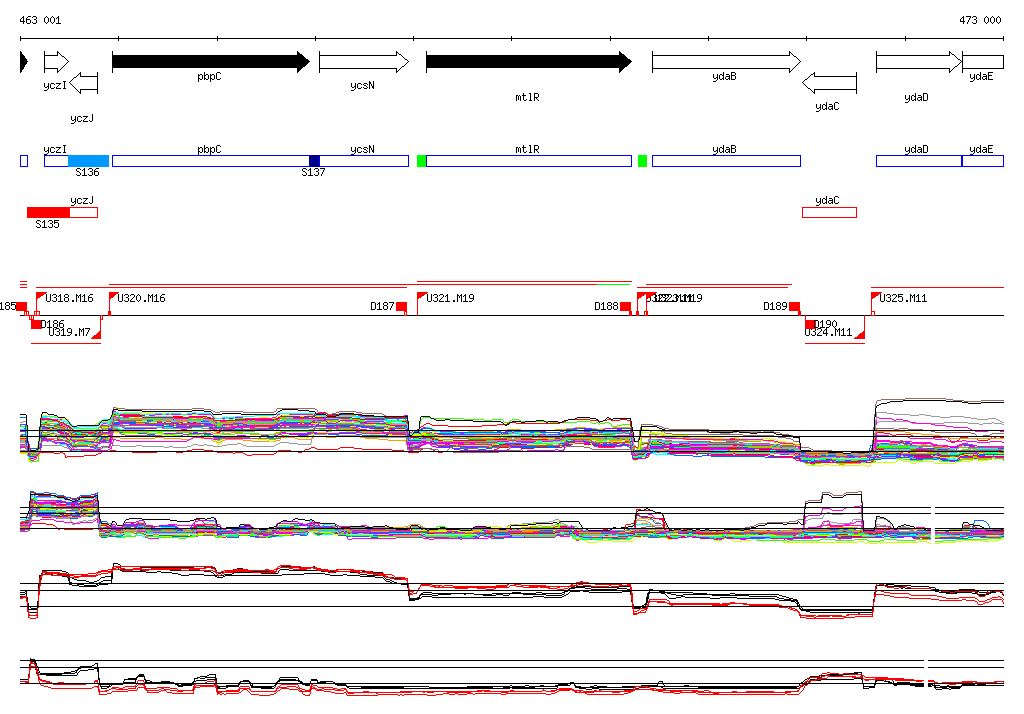
Genomic View of Gene/Segment mtlR
Show/Hide
(Legend)
Browse Genome Context