| Start Page |
|
 |
| Start Page |
|
|
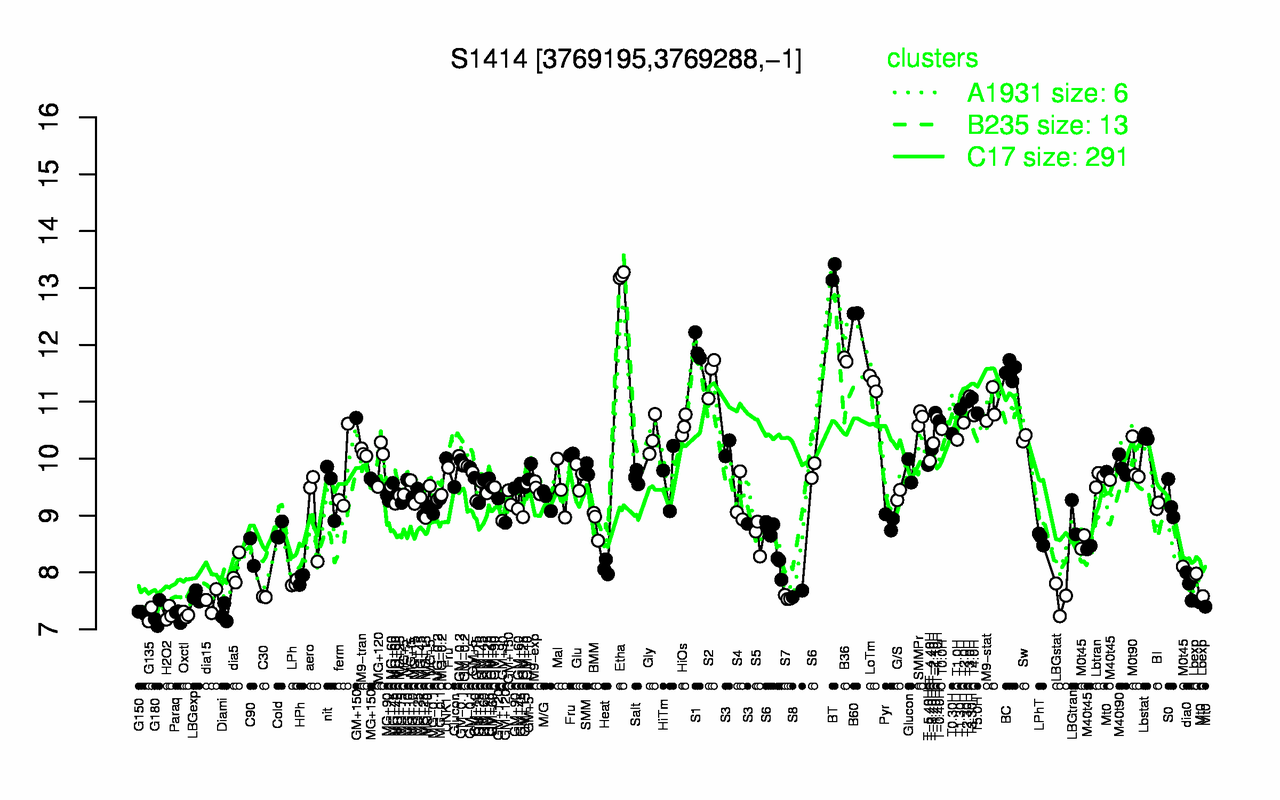
| BT | Etha | B60 | S1 | B36 | BC | S2 | LoTm | T3.0H | T3.30H |
| 13.3 | 13.2 | 12.6 | 11.9 | 11.7 | 11.6 | 11.5 | 11.3 | 11.1 | 11.1 |
| Paraq | G180 | Oxctl | G135 | H2O2 | Diami | G150 | dia15 | LBGstat | S7 |
| 7.24 | 7.25 | 7.26 | 7.26 | 7.27 | 7.28 | 7.3 | 7.5 | 7.54 | 7.56 |