| Start Page |
|
 |
| Start Page |
|
|
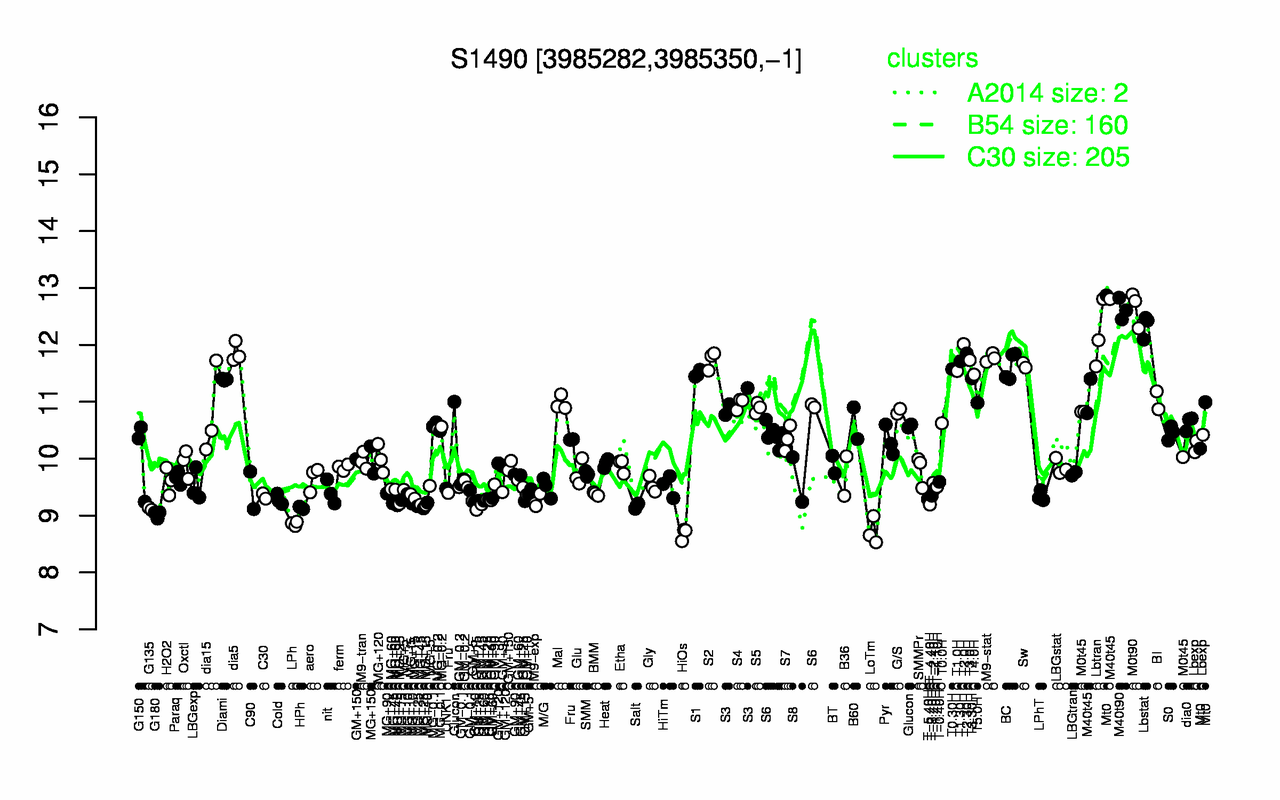
| M0t90 | M40t90 | Lbstat | Lbtran | T2.0H | dia5 | T2.30H | M9-stat | S2 | T3.0H |
| 12.7 | 12.6 | 12.3 | 12.2 | 12 | 11.9 | 11.9 | 11.8 | 11.7 | 11.7 |
| HiOs | LoTm | LPh | G180 | G135 | HPh | Salt | MG+25 | T-4.40H | MG+45 |
| 8.68 | 8.73 | 8.86 | 9.02 | 9.12 | 9.13 | 9.17 | 9.17 | 9.19 | 9.2 |