| Start Page |
|
 |
| Start Page |
|
|
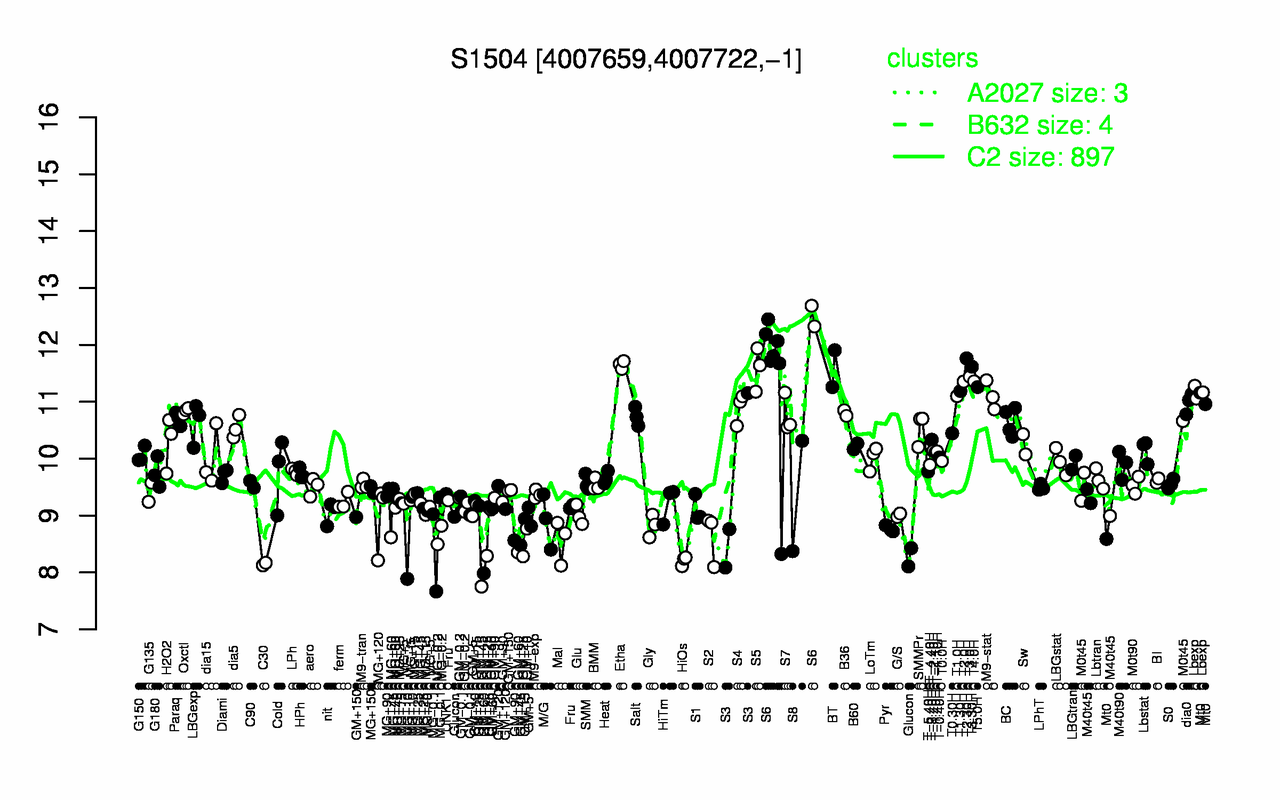
| T2.30H | S6 | Etha | T3.30H | S5 | BT | T3.0H | T4.0H | T2.0H | T5.0H |
| 11.8 | 11.7 | 11.7 | 11.6 | 11.6 | 11.6 | 11.4 | 11.4 | 11.4 | 11.3 |
| C30 | HiOs | GM+45 | GM+60 | Glucon | Mal | GM+25 | S2 | MG-0.2 | MG-0.1 |
| 8.15 | 8.2 | 8.45 | 8.49 | 8.5 | 8.56 | 8.58 | 8.63 | 8.66 | 8.67 |