| Start Page |
|
 |
| Start Page |
|
|
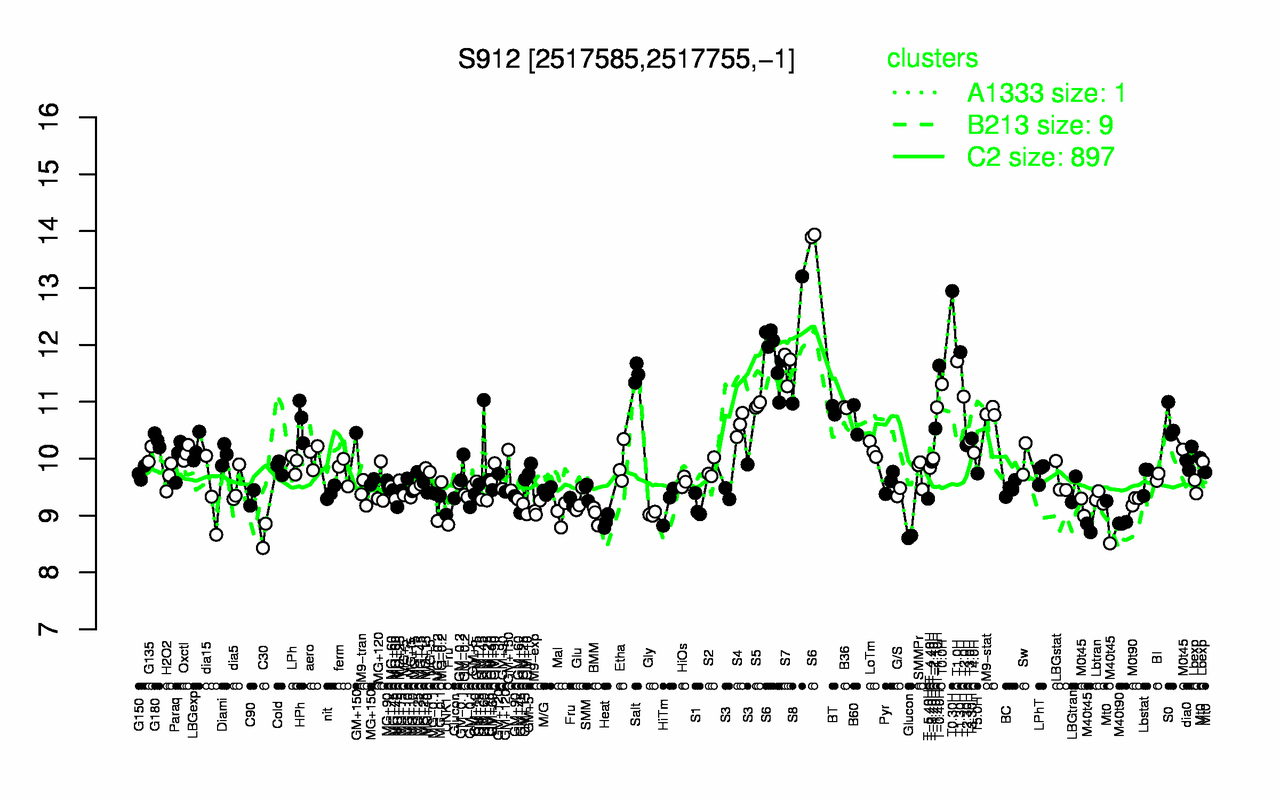
| T0.30H | S6 | S8 | T1.30H | T1.0H | T-0.40H | S7 | Salt | T0.0H | T2.0H |
| 12.9 | 12.3 | 12.1 | 11.9 | 11.7 | 11.6 | 11.6 | 11.5 | 11.3 | 11.1 |
| C30 | M40t45 | Glucon | M40t90 | Heat | BMM | UNK1 | Gly | Mal | Fru |
| 8.64 | 8.69 | 8.85 | 8.87 | 8.9 | 9.01 | 9.01 | 9.03 | 9.03 | 9.1 |