| Start Page |
|
 |
| Start Page |
|
|
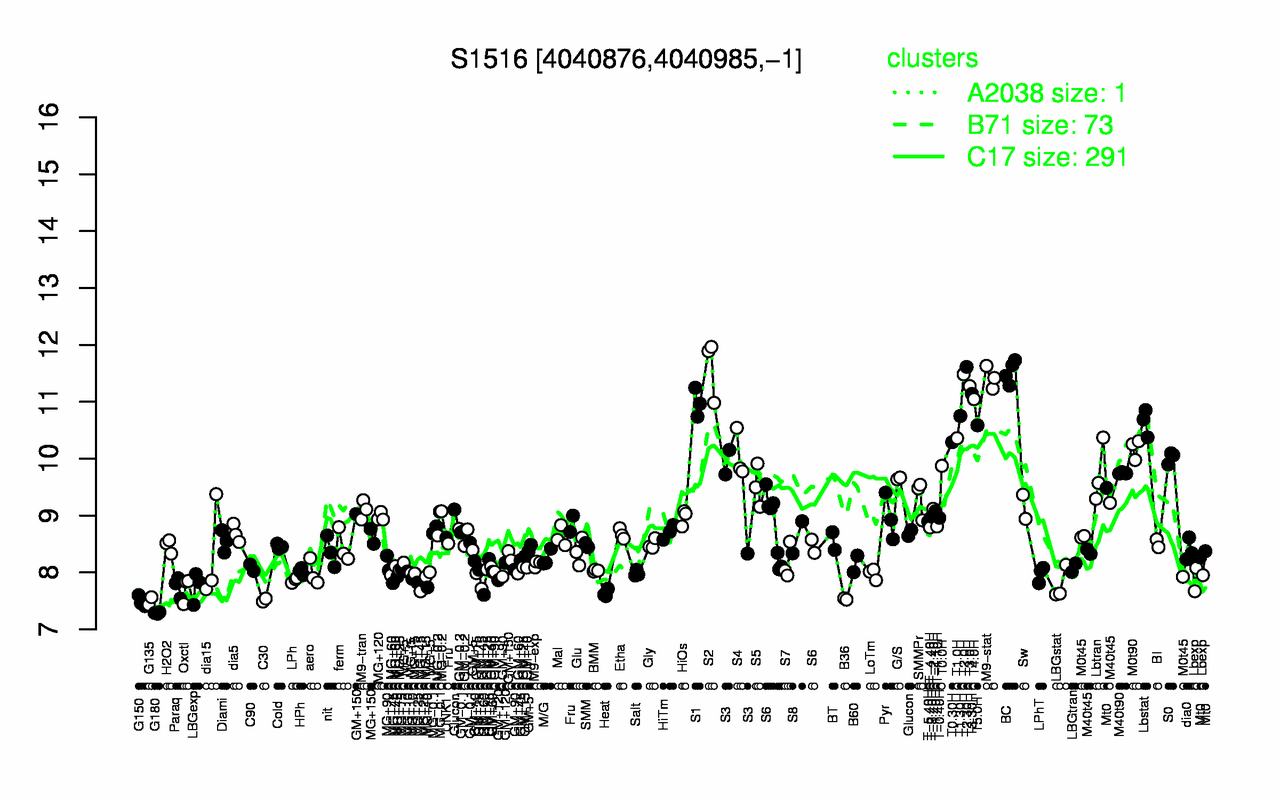
| S2 | T2.30H | BC | T2.0H | M9-stat | T3.0H | T3.30H | T4.0H | S1 | T1.30H |
| 11.6 | 11.6 | 11.5 | 11.5 | 11.4 | 11.3 | 11.1 | 11 | 11 | 10.8 |
| G180 | G150 | G135 | C30 | B36 | Heat | Oxctl | LBGexp | Paraq | LBGstat |
| 7.29 | 7.49 | 7.5 | 7.51 | 7.53 | 7.64 | 7.71 | 7.74 | 7.75 | 7.79 |