| Start Page |
|
 |
| Start Page |
|
|
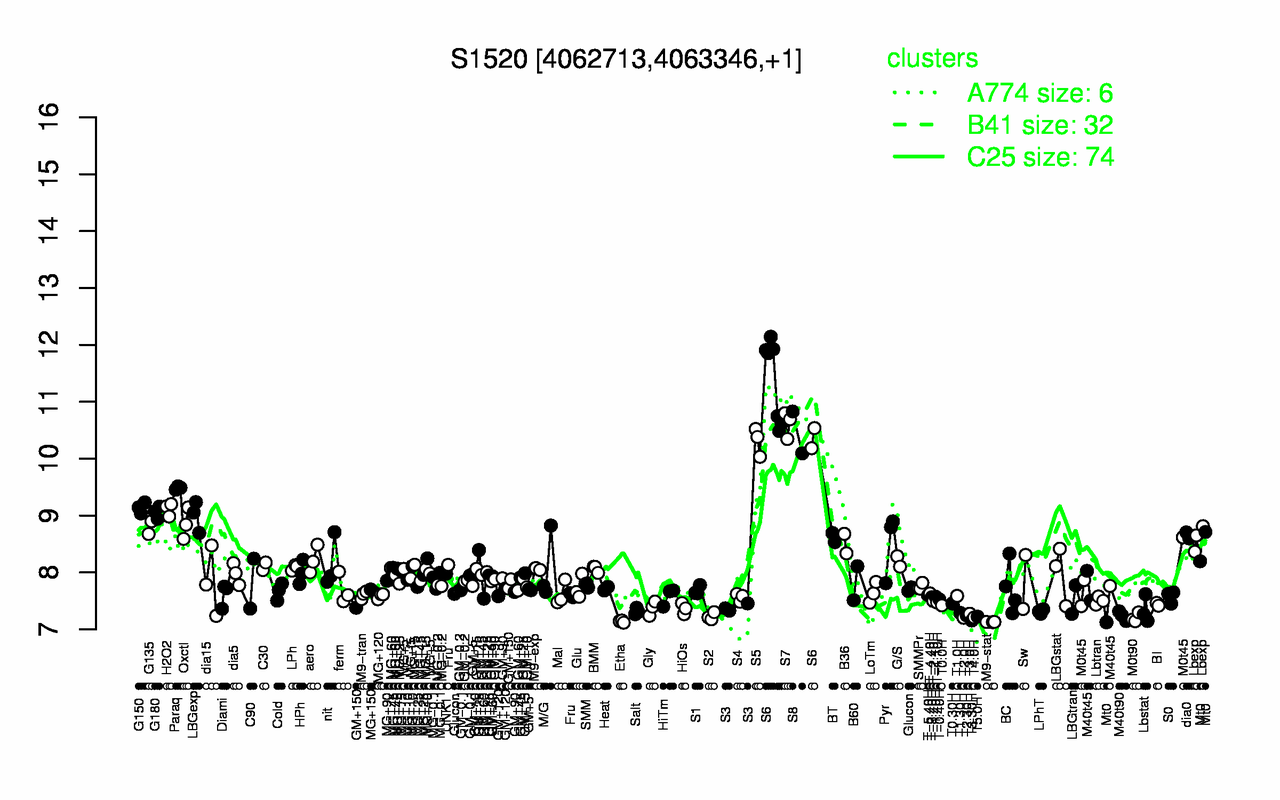
| S6 | S7 | S8 | S5 | Paraq | G150 | H2O2 | G180 | LBGexp | Oxctl |
| 11.2 | 10.6 | 10.5 | 10.3 | 9.49 | 9.14 | 9.11 | 9.05 | 8.99 | 8.86 |
| M9-stat | Etha | T3.30H | M0t90 | T2.0H | T4.0H | T5.0H | S2 | M40t90 | T2.30H |
| 7.13 | 7.14 | 7.16 | 7.2 | 7.2 | 7.21 | 7.22 | 7.23 | 7.24 | 7.24 |