| Start Page |
|
 |
| Start Page |
|
|
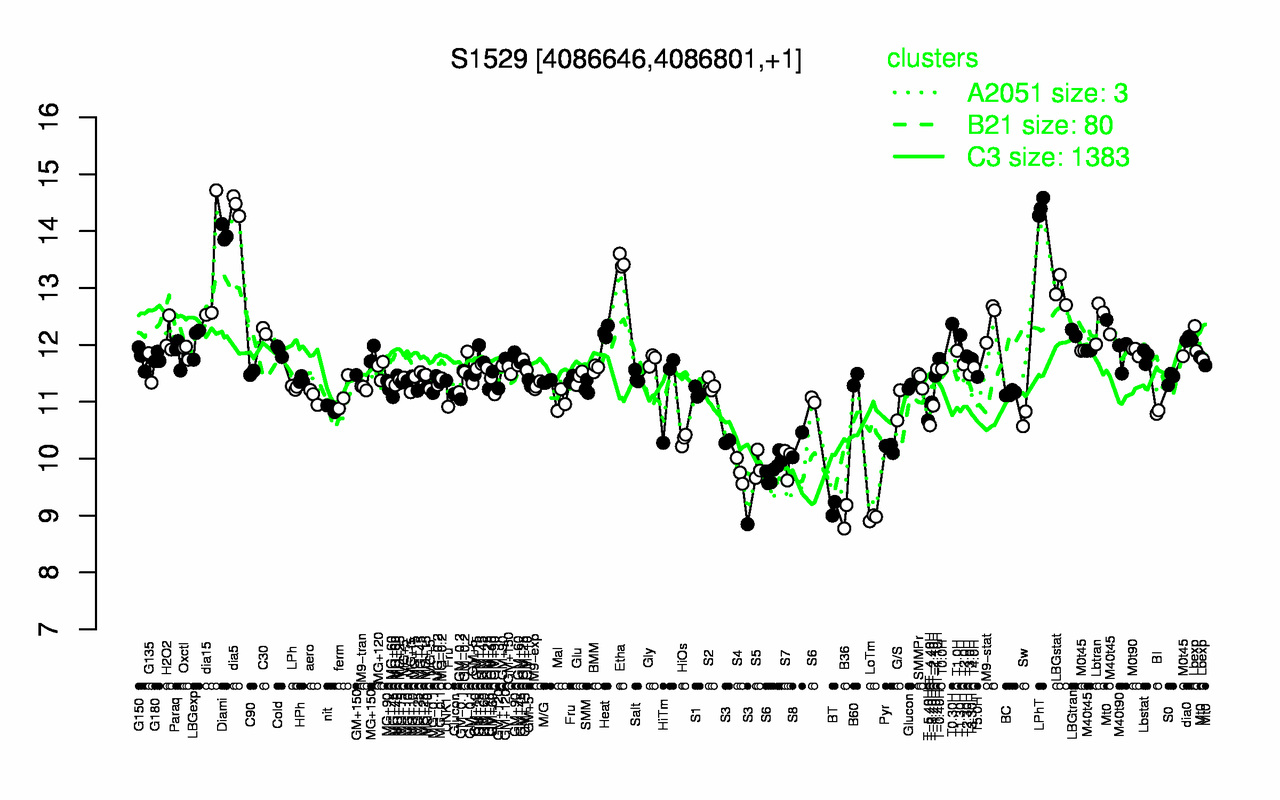
| dia5 | LPhT | Diami | Etha | dia15 | LBGstat | M9-stat | Lbtran | T0.30H | C30 |
| 14.5 | 14.4 | 14 | 13.5 | 13.3 | 12.9 | 12.4 | 12.4 | 12.4 | 12.2 |
| LoTm | B36 | BT | S4 | S3 | S5 | S7 | S6 | Pyr | S8 |
| 8.96 | 8.98 | 9.12 | 9.78 | 9.81 | 9.87 | 9.95 | 10.1 | 10.2 | 10.2 |