| Start Page |
|
 |
| Start Page |
|
|
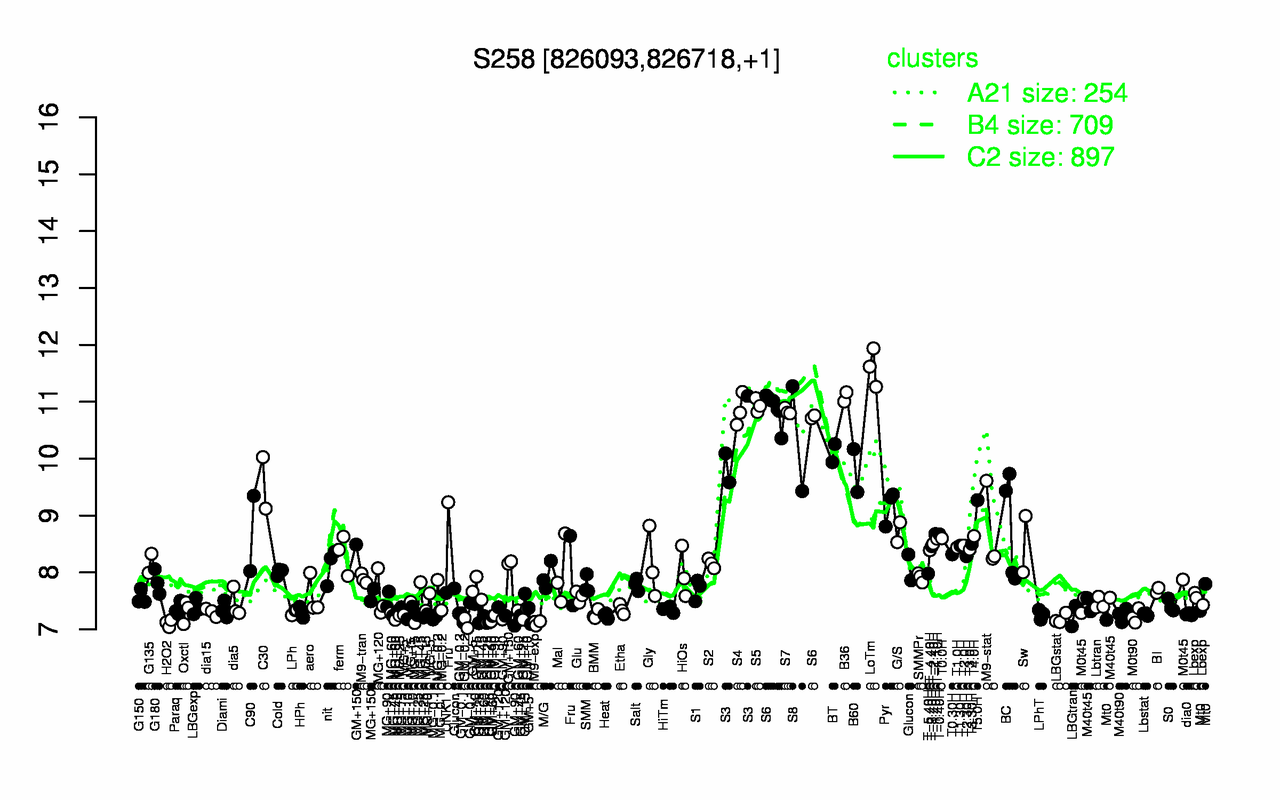
| LoTm | B36 | S5 | S6 | S4 | S7 | S8 | S3 | BT | B60 |
| 11.6 | 11.1 | 10.9 | 10.9 | 10.9 | 10.8 | 10.4 | 10.3 | 10.1 | 9.79 |
| H2O2 | M9-exp | GM+25 | GM+90 | GM-0.2 | LBGstat | MG+60 | M0t90 | LBGtran | MG+25 |
| 7.11 | 7.11 | 7.13 | 7.16 | 7.17 | 7.19 | 7.23 | 7.23 | 7.23 | 7.23 |