B. subtilis Expression Data Browser
Start Page
B. subtilis Expression Data Browser
Gene/Segment:
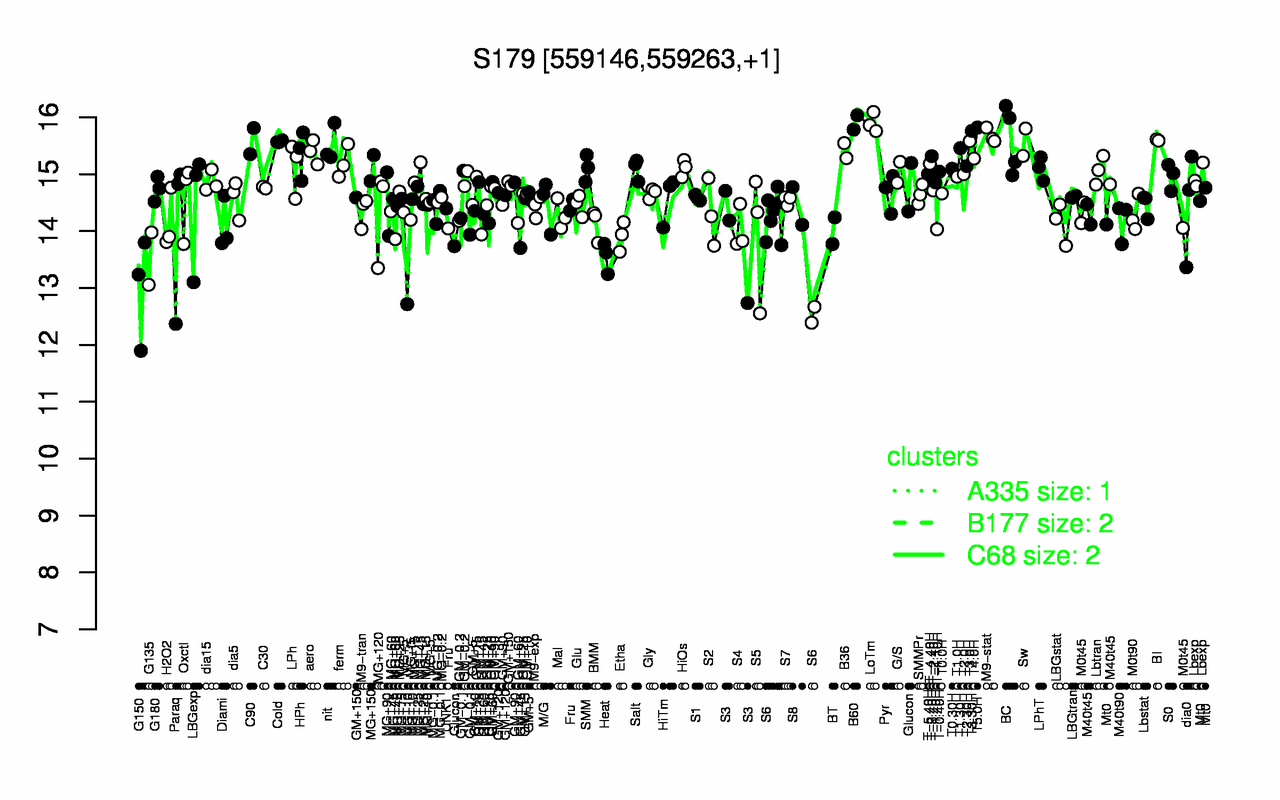
S179
Locus Tag:
new_559146_559263
Details about S179
Show/Hide
Highest Expression Conditions
B60
LoTm
T5.0H
T3.30H
M9-stat
BI
BC
C90
T3.0H
Cold
15.9
15.9
15.8
15.8
15.7
15.6
15.6
15.6
15.6
15.6
Lowest Expression Conditions
G150
G135
Heat
S3
S6
Etha
MG+10
S5
BT
S4
13
13.5
13.5
13.9
13.9
13.9
13.9
13.9
14
14
Most Positively Correlated Segments
cspC
S813
ydzW
S815
S1375
prsW
S817
ygzB
veg
S315
0.77
0.58
0.56
0.56
0.54
0.54
0.54
0.53
0.52
0.5
Most Negatively Correlated Segments
prpE
thiN
yxeA
pgsB
yclI
S1065
yfmL
yheB
mhqA
yyaL
-0.48
-0.47
-0.46
-0.45
-0.45
-0.44
-0.44
-0.44
-0.43
-0.43
Expression Profile of Segment S179
Show/Hide
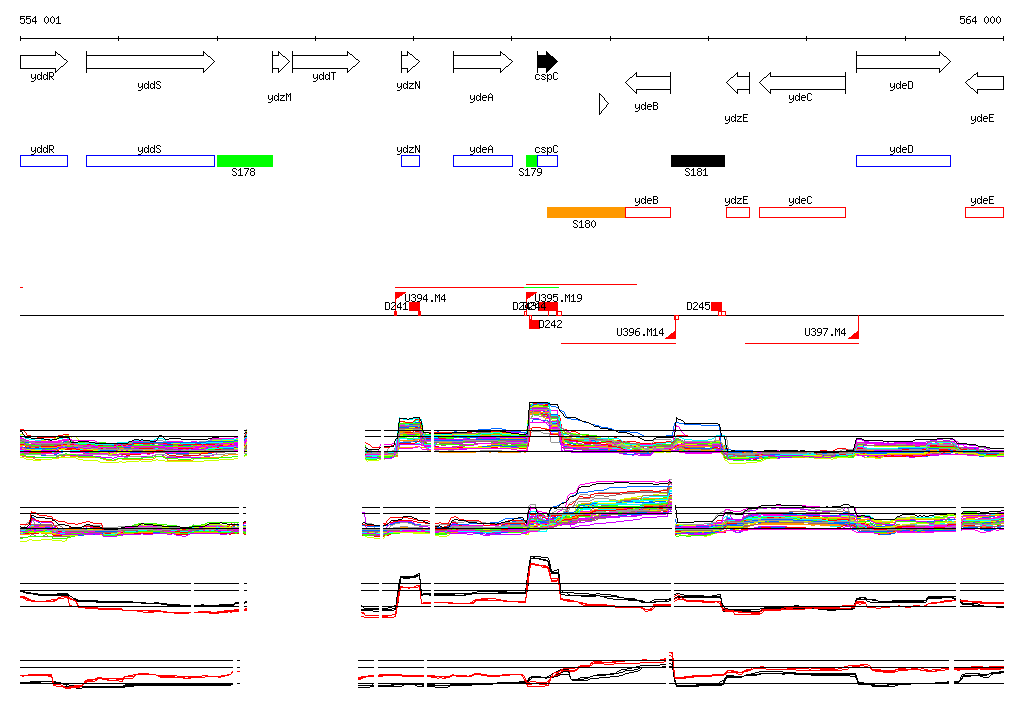
Genomic View of Gene/Segment S179
Show/Hide
(Legend)
Browse Genome Context