| Start Page |
|
 |
| Start Page |
|
|
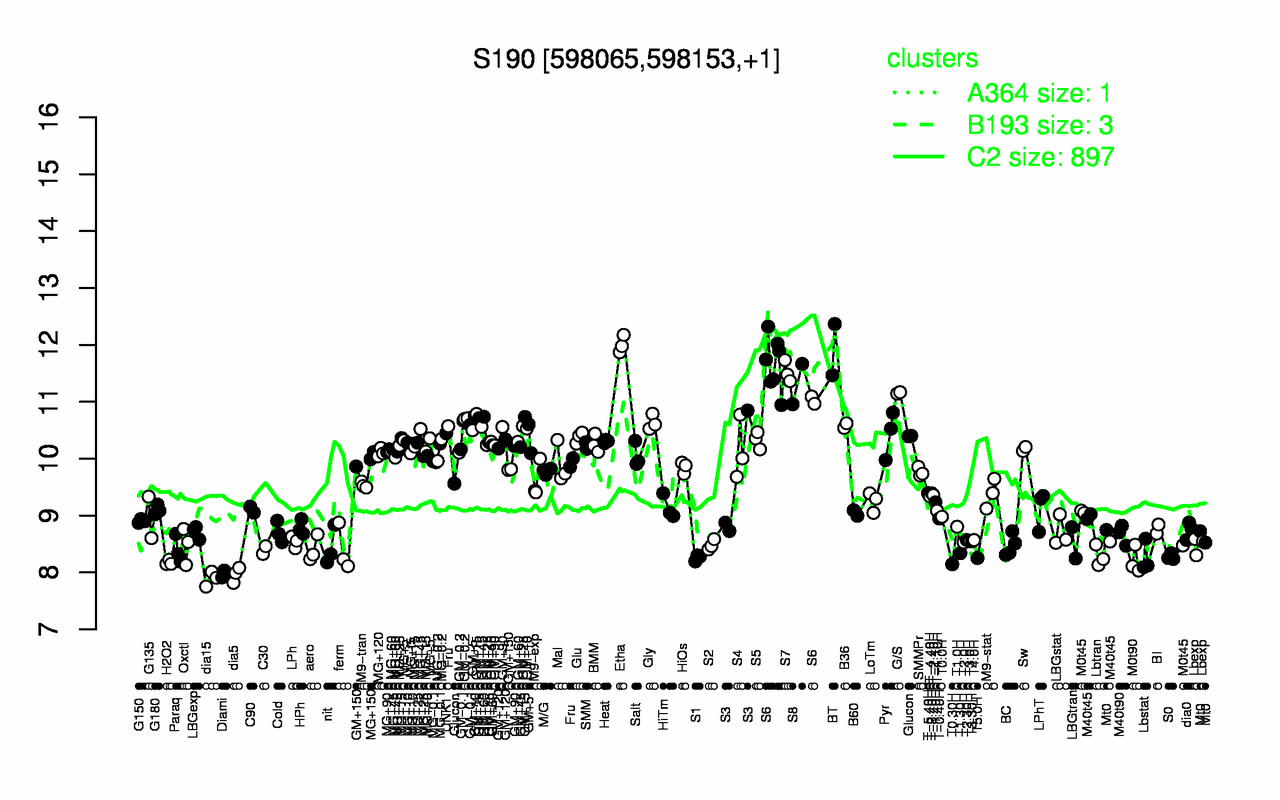
| Etha | BT | S6 | S7 | S8 | G/S | GM+10 | Gly | GM+15 | B36 |
| 12 | 11.9 | 11.5 | 11.5 | 11.3 | 11.2 | 10.6 | 10.6 | 10.6 | 10.6 |
| dia15 | dia5 | Diami | T0.30H | H2O2 | M0t90 | T5.0H | S1 | Lbstat | S0 |
| 7.89 | 7.96 | 7.98 | 8.14 | 8.17 | 8.21 | 8.25 | 8.26 | 8.27 | 8.28 |