| Start Page |
|
 |
| Start Page |
|
|
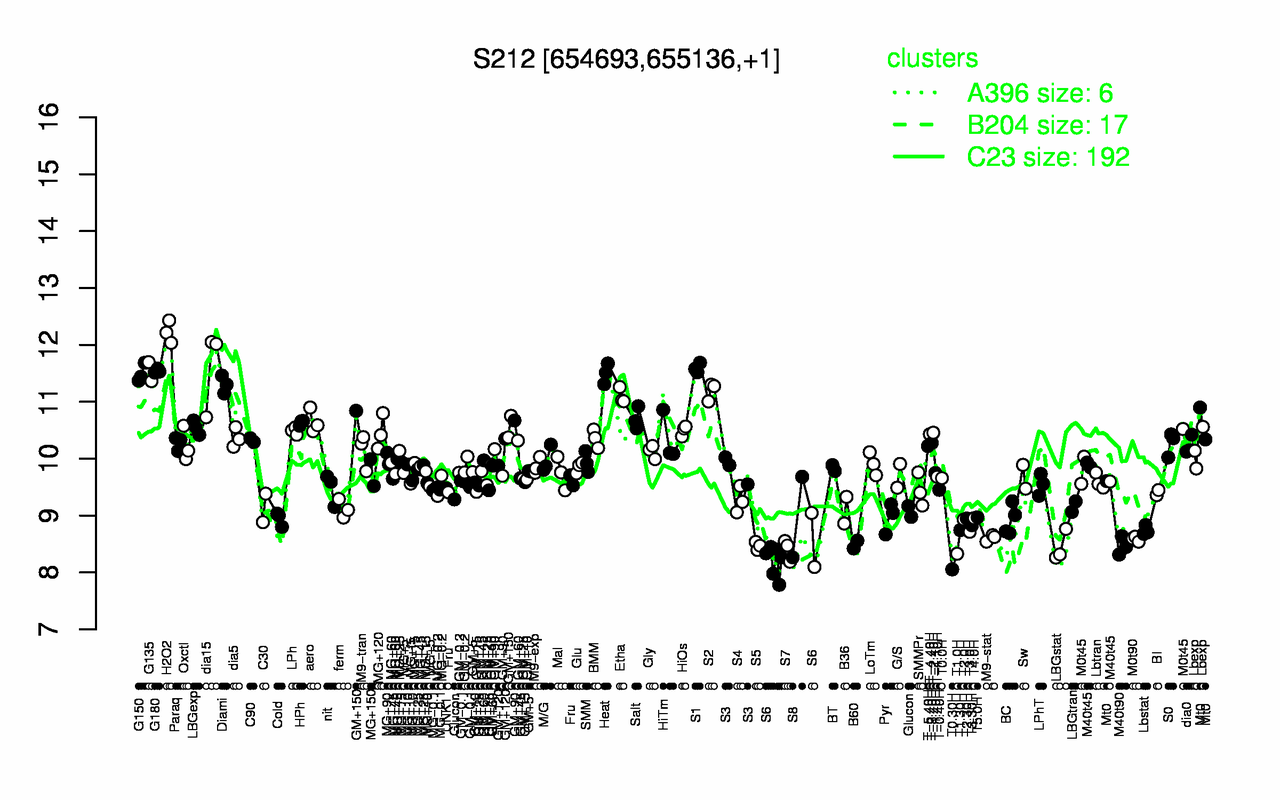
| H2O2 | dia15 | S1 | G180 | G135 | G150 | Heat | Diami | S2 | Etha |
| 12.2 | 11.6 | 11.6 | 11.5 | 11.5 | 11.5 | 11.5 | 11.3 | 11.2 | 11.1 |
| T0.30H | S6 | T1.0H | S7 | LBGstat | M40t90 | S5 | B60 | M0t90 | M9-stat |
| 8.05 | 8.3 | 8.33 | 8.4 | 8.45 | 8.47 | 8.47 | 8.49 | 8.59 | 8.61 |