| Start Page |
|
 |
| Start Page |
|
|
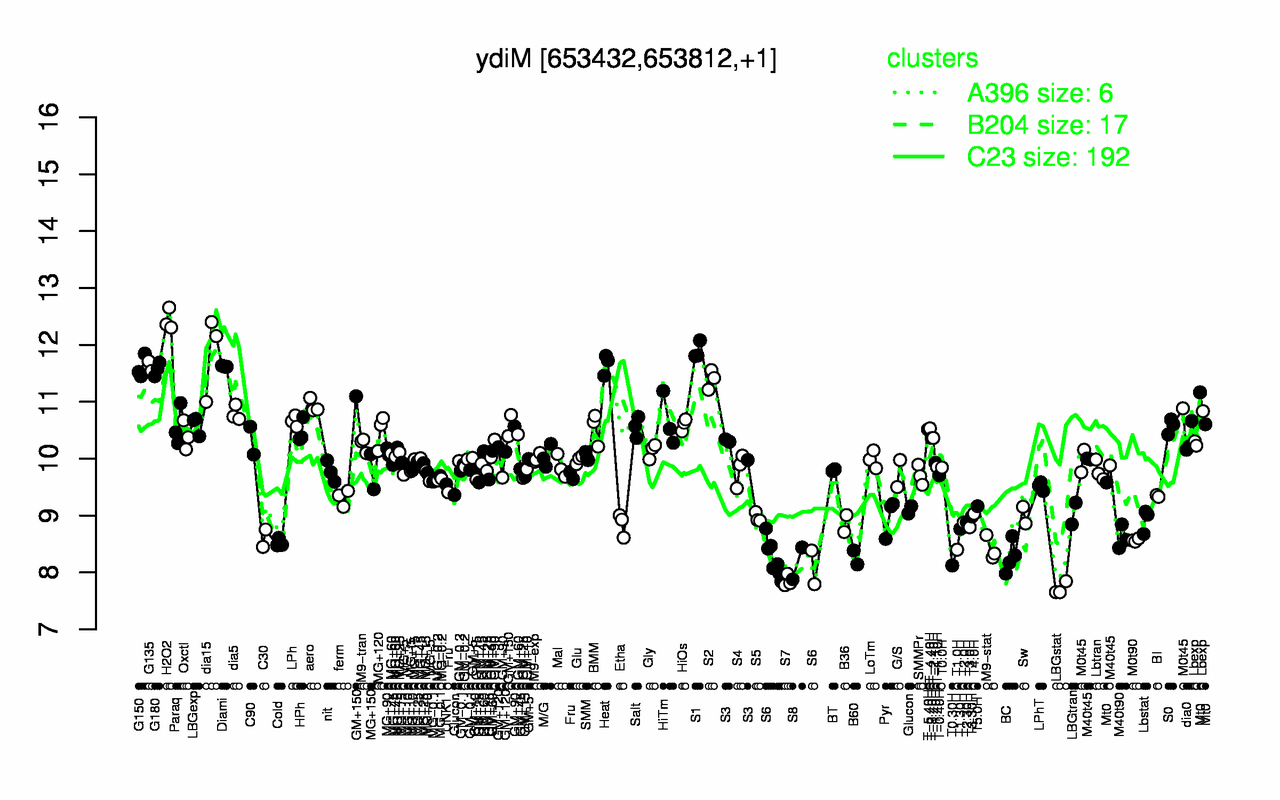
| H2O2 | S1 | dia15 | Heat | G135 | Diami | G150 | G180 | S2 | aero |
| 12.4 | 11.9 | 11.9 | 11.7 | 11.6 | 11.6 | 11.6 | 11.6 | 11.4 | 10.9 |
| LBGstat | S7 | T0.30H | S8 | S6 | B60 | BC | T1.0H | M9-stat | Cold |
| 7.72 | 7.86 | 8.12 | 8.16 | 8.21 | 8.26 | 8.27 | 8.4 | 8.42 | 8.52 |