| Start Page |
|
 |
| Start Page |
|
|
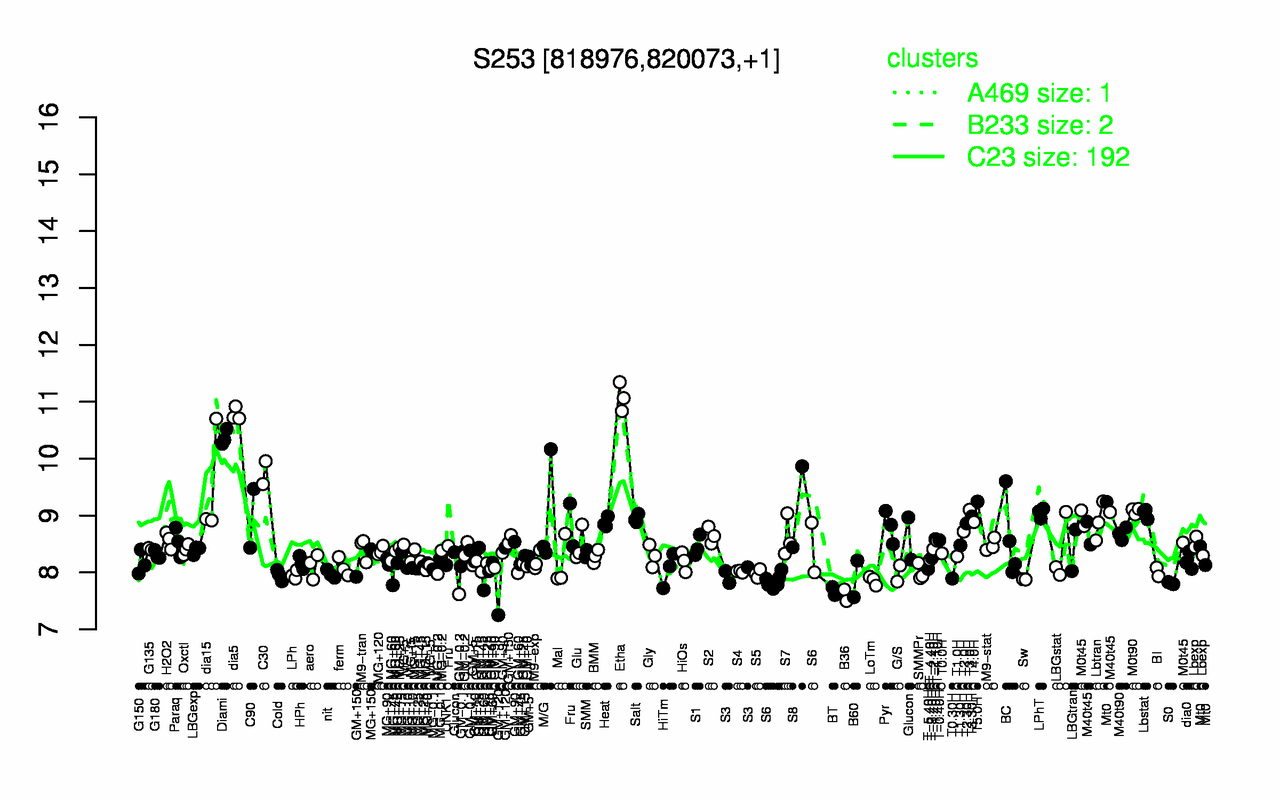
| Etha | dia5 | Diami | C30 | dia15 | T5.0H | S8 | T3.0H | M0t90 | LPhT |
| 11.1 | 10.8 | 10.4 | 9.75 | 9.52 | 9.25 | 9.15 | 9.1 | 9.08 | 9.05 |
| B36 | BT | S0 | GM+120 | LoTm | Sw | B60 | T0.30H | GM+60 | Cold |
| 7.6 | 7.67 | 7.81 | 7.84 | 7.86 | 7.88 | 7.89 | 7.89 | 7.95 | 7.95 |