| Start Page |
|
 |
| Start Page |
|
|
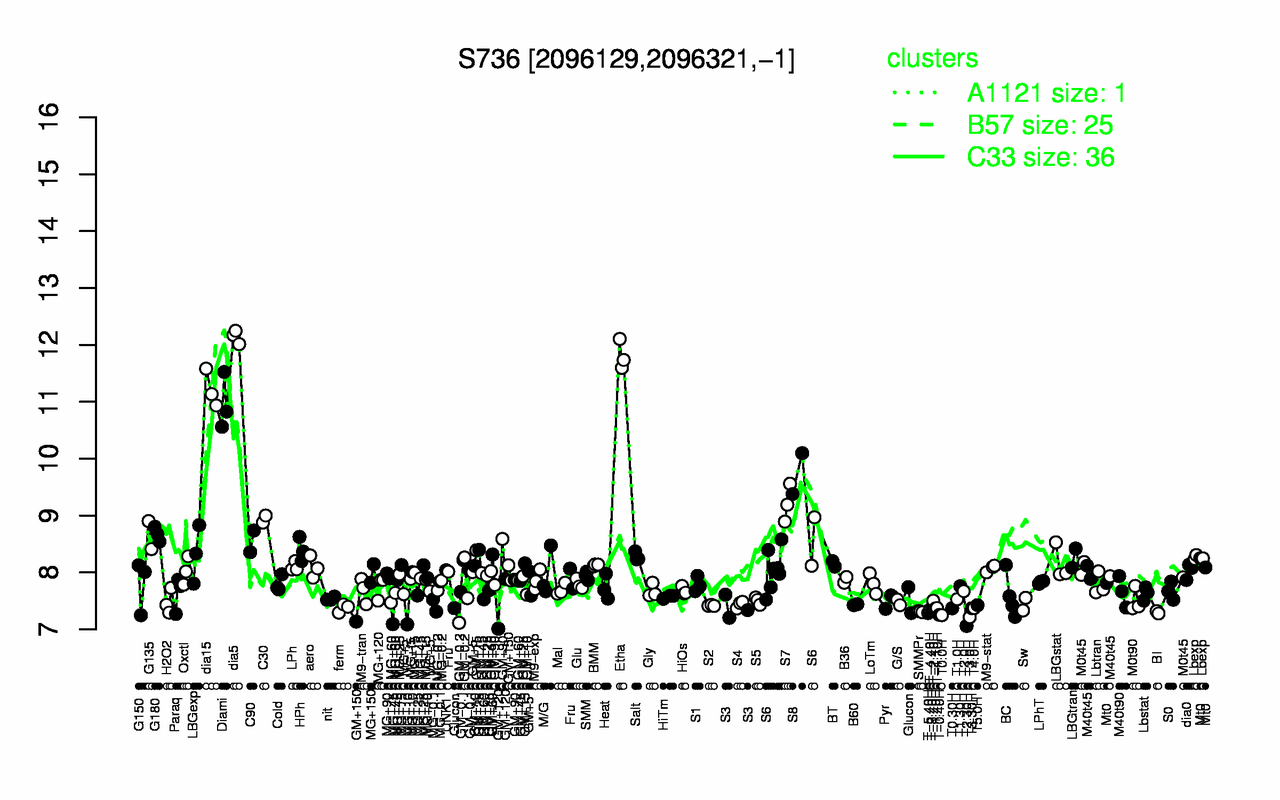
| dia5 | Etha | dia15 | Diami | S8 | S7 | C30 | G180 | G135 | C90 |
| 12.1 | 11.8 | 11.2 | 11 | 9.74 | 9.21 | 8.94 | 8.67 | 8.66 | 8.55 |
| T2.30H | T3.0H | T0.0H | T-0.40H | T-5.40H | BI | SMMPr | T-3.40H | T-4.40H | T3.30H |
| 7.06 | 7.21 | 7.25 | 7.26 | 7.29 | 7.3 | 7.31 | 7.34 | 7.35 | 7.37 |