| Start Page |
|
 |
| Start Page |
|
|
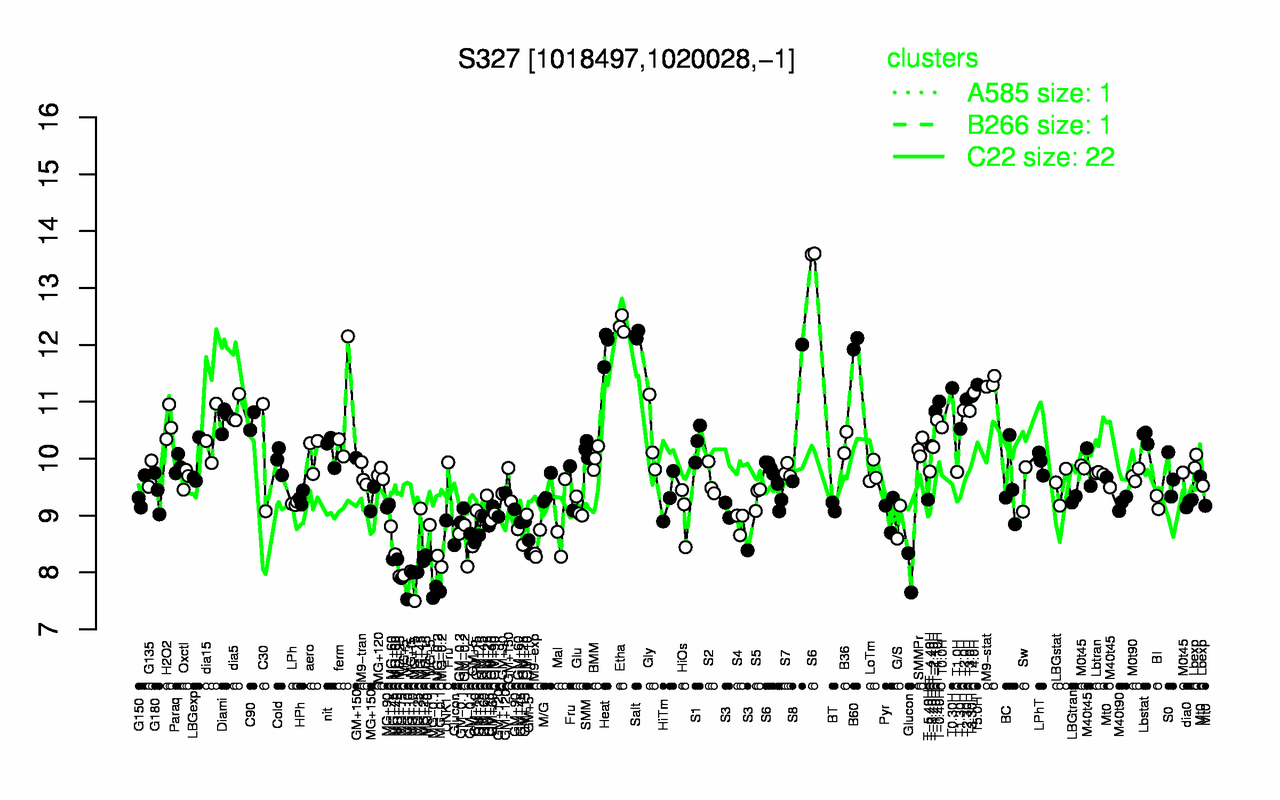
| Etha | Salt | B60 | Heat | M9-stat | T5.0H | T0.30H | T4.0H | T3.30H | T2.30H |
| 12.4 | 12.2 | 12 | 12 | 11.3 | 11.3 | 11.2 | 11.2 | 11.1 | 11 |
| MG-0.1 | MG+15 | MG+10 | MG+t5 | MG+25 | Glucon | MG-0.2 | MG+5 | M9-exp | GM+5 |
| 7.66 | 7.9 | 7.94 | 8.02 | 8.05 | 8.16 | 8.2 | 8.39 | 8.45 | 8.45 |