B. subtilis Expression Data Browser
Details about disA Show/Hide
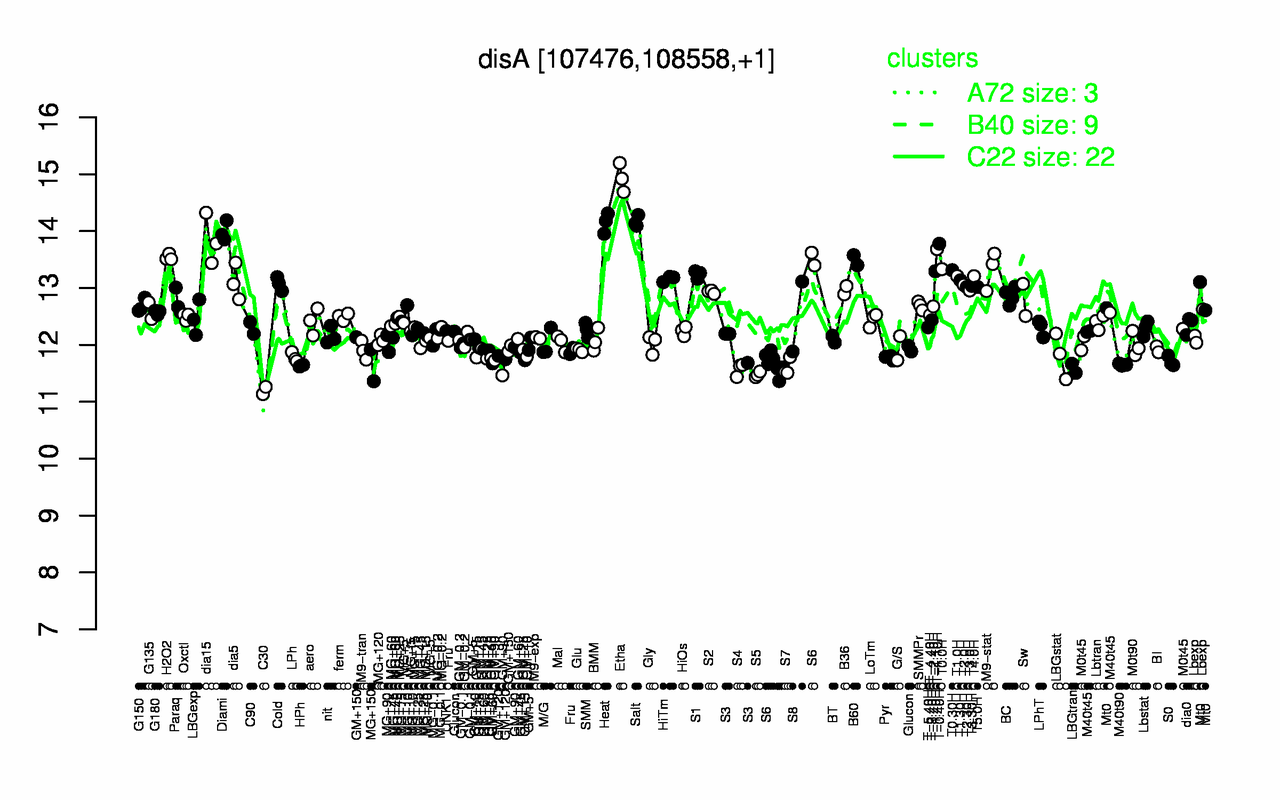
Highest Expression Conditions
Etha Salt Heat Diami dia15 T-0.40H T-1.10H H2O2 B60 T0.0H
14.9 14.2 14.1 14 13.8 13.8 13.7 13.5 13.5 13.3
Lowest Expression Conditions
C30 S5 S4 LBGtran S7 HPh MG+150 M40t90 S0 GM+90
11.2 11.5 11.6 11.6 11.6 11.6 11.6 11.7 11.7 11.7
Most Positively Correlated Segments
radA S45 yacL mcsB mcsA ctsR yrhH yqjL ywaC clpC
0.94 0.93 0.76 0.75 0.75 0.74 0.71 0.71 0.7 0.69
Most Negatively Correlated Segments
ytlR S1350 S1422 ndoA atpF amyX yvoF ylxL cgeE asd
-0.51 -0.51 -0.48 -0.48 -0.47 -0.47 -0.46 -0.46 -0.46 -0.45
Expression Profile of Segment disA Show/Hide
Annotation of Gene disA Show/Hide
function
16.6: Maintain
function
16.3: Control
inference
ab initio prediction:AMIGene:2.0
codon_start
1
product
DNA integrity scanning protein; cell cycle checkpoint DNA scanning protein
transl_table
11
note
Evidence 1a: Function experimentally demonstrated in the studied strain; PubMedId: 16713562; Product type cp: cell process
db_xref
GI:2632355
protein_id
CAB11864.1
Genomic View of Gene/Segment disA Show/Hide
(Legend)