| Start Page |
|
 |
| Start Page |
|
|
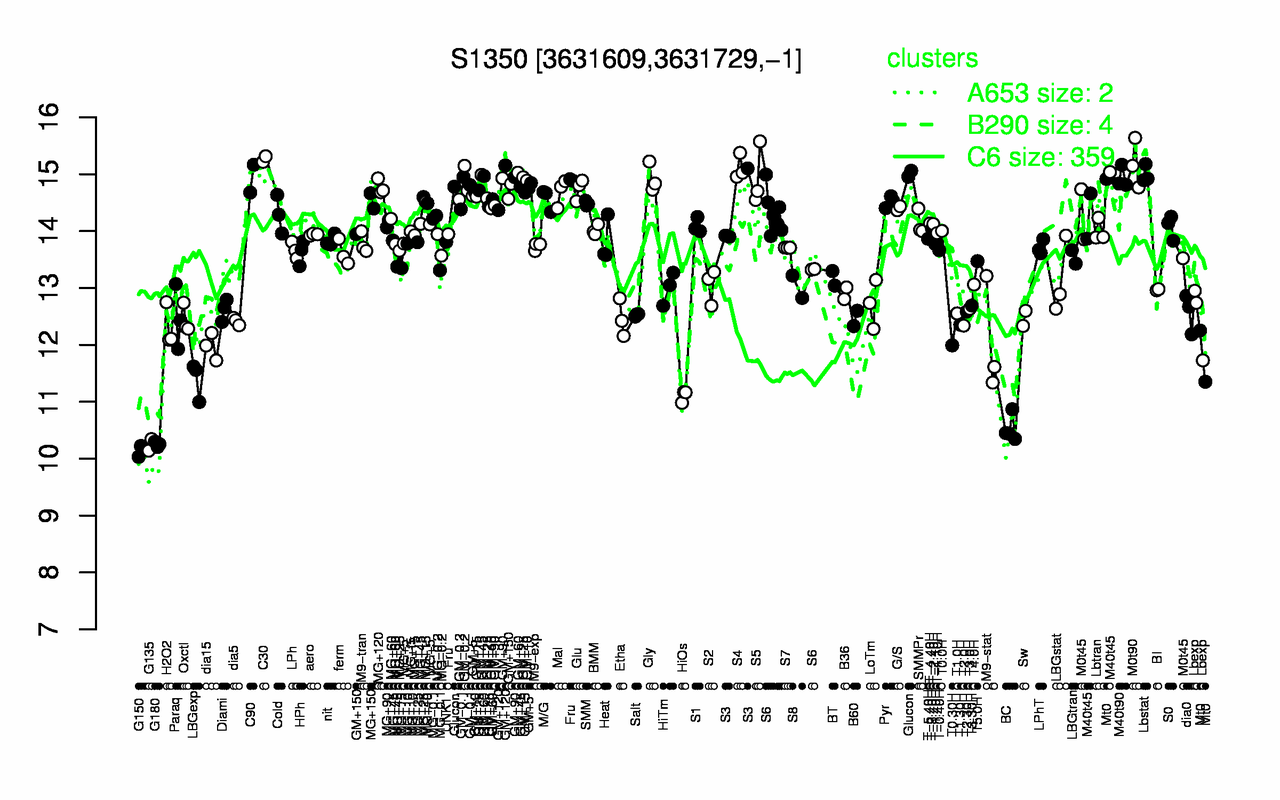
| C30 | M0t90 | S4 | Lbstat | S5 | M40t90 | Glucon | Gly | C90 | GM+60 |
| 15.3 | 15.2 | 15.1 | 15 | 14.9 | 14.9 | 14.9 | 14.9 | 14.9 | 14.9 |
| G150 | G135 | G180 | BC | HiOs | LBGexp | dia15 | T0.30H | M9-stat | H2O2 |
| 10.1 | 10.2 | 10.3 | 10.5 | 11.1 | 11.4 | 12 | 12 | 12.1 | 12.3 |