| Start Page |
|
 |
| Start Page |
|
|
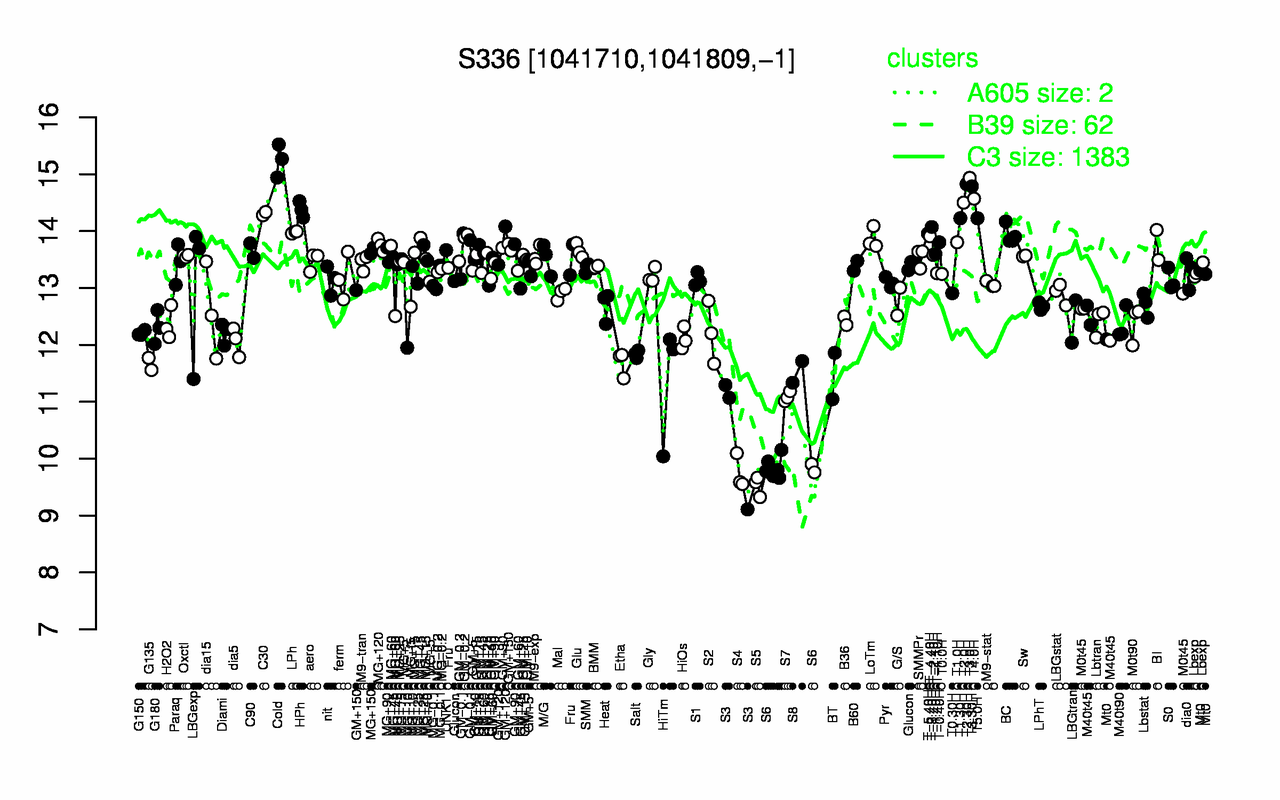
| Cold | T3.0H | T2.30H | T3.30H | T4.0H | T2.0H | HPh | C30 | T1.30H | T5.0H |
| 15.2 | 14.9 | 14.8 | 14.8 | 14.6 | 14.5 | 14.4 | 14.3 | 14.2 | 14.2 |
| S5 | S4 | S6 | S3 | S7 | HiTm | BT | S8 | G135 | Etha |
| 9.53 | 9.75 | 9.83 | 10.5 | 11.1 | 11.4 | 11.5 | 11.5 | 11.7 | 11.7 |